The Senate is currently in intense debate regarding raising the federal minimum wage. Several potential wages have been proposed, including a $10/hour plan from Senators Romney and Cotton and a more generous $15/hour plan from the progressive Democrats. Right now the current federal minimum wage stands at $7.25 per hour, which 21 states (including my notably Blue home state of Virginia) adhere to. While the debate rages on, I wanted to take a closer look at the history of the minimum wage, the concept of a “living wage”, and how these two terms invariably tie together across the United States.
More importantly, at some point, there are diminishing returns and increasing costs to increasing the minimum wage. So where should we settle?
The History of the Minimum Wage
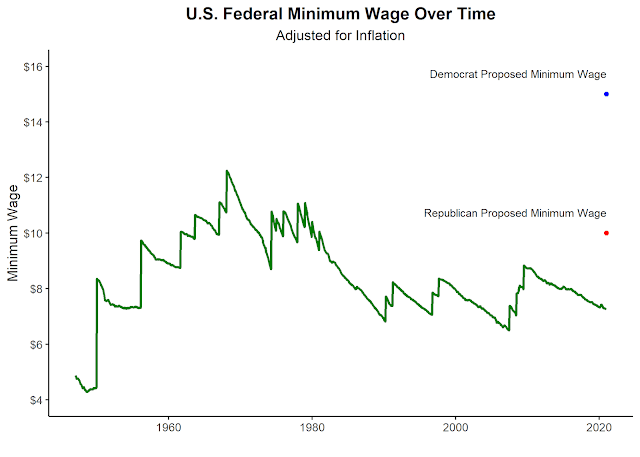
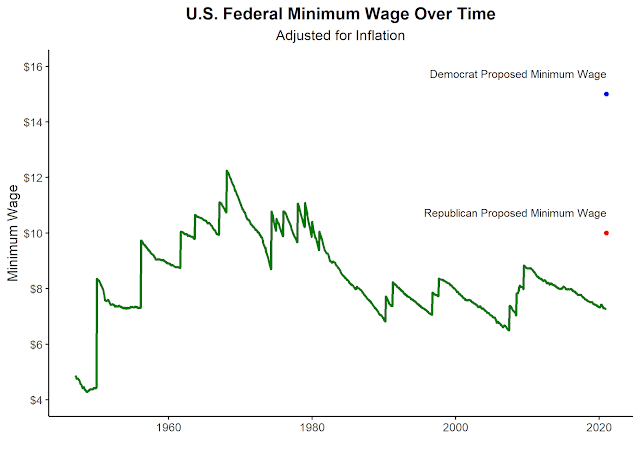
This isn’t a history blog, so I’ll be brief. The minimum wage was established under the Fair Labor Standards Act in 1938 and set at $0.25/hour, which is worth around $4.60/hour today. Since then, it has been raised 20 times (most recently in 2009), by an average of 17% each time. The largest increase was in 1950, when it was raised from $0.40/hr to $0.70/hr (an 88% increase). The proposed Democrat increase of $15/hr would be the largest minimum wage increase in American history at 107%. The Republican counterproposal of $10/hr would be a more modest 38% increase.
The chart below summarizes the history of the federal minimum wage since its inception:
The average historical federal minimum wage is approximately $8, indicating that the current wage is slightly below historical averages. However, the average obscures that during certain periods of history, the minimum wage was substantially higher than $7.25. During the 1960’s and 1970’s, the minimum wage hovered around $10-$11/hour, peaking at $12.25 in 2021 dollars in 1968. A $15 minimum wage would represent a 22% increase from this peak. A $10 minimum wage would be an 18% decrease.
Contextualizing the Minimum Wage
Now that we’ve historically contextualized the minimum wage, let’s contemporarily contextualize it. Who makes the minimum wage? What do minimum wage workers look like? Who will be most helped here?
Let’s profile the demographics of those making the federal minimum wage. Although the population skews young (43% are 16-24), there is a substantial portion of the population that is aged 35+ (32%). Women are overrepresented, and Black people slightly overrepresented (although probably not statistically significantly so). The notion that minimum wage earners are poorly educated is a myth. 82% have at least a High School Degree or a GED, and 35% of them have at least some college schooling. These education rates are comparable to the general wage earning population. Most minimum wage earners (65%) have never married.
I’d like to point out one thing that I mentioned earlier. The federal minimum wage doesn’t apply to all states in the Union. Only 21 states observe the federal minimum wage. In fact, 21 states representing 45% of Americans already have a minimum wage higher than $10/hr. Dozens of localities within states have drafted legislation that have raised their local minimum wage even further — as high as $15/hr in some cities. I think that’s an important distinction to make to frame any discussion about raising the minimum wage. It’s unclear if the demographics of people making the minimum wage of $10.10 in Maryland resemble the demographics of people making the federal minimum wage of $7.25 in Virginia.
Living Wage
Here’s where things get a little tricky. What exactly should the minimum wage be? What is a “living wage”? This discussion is made all the more complicated that cost-of-living (COL) varies wildly across the U.S. — of course a salary of $50,000 in Richmond, Virginia is very different than a salary of $50,000 in New York City. For the purposes of this post, I adopt the “living wage model” as laid out by Amy Glasmeier, Professor of Economic Geography at MIT, which draws upon geographically specific expenditure data related to a family’s likely minimum food, childcare, health insurance, housing, transportation, and other necessities (e.g., clothing, personal care items, etc.) costs. Ultimately, her “living wage” draws on these cost elements and the rough effects of income and payroll taxes to determine the minimum employment earnings necessary to meet a family’s basic needs while also maintaining self-sufficiency. Things not provided for in this living wage model:
- Funds for frequent meals in restaurants
- Funds for holidays (I think they mean expensive out-of-country holidays)
- Allocated funds for unpaid holidays (need to work 40/hrs a week for 52 weeks; this also means no unpaid sick time)
- Financial means for planning for the future through substantial savings or investments (i.e. retirement savings) — need to rely on state funds upon retirement
I just want to be clear what the “living wage” I’ll be talking about in this post is. This will be a wage for a family unit to work full-time (no overtime) and maintain self-sufficiency. As a sanity check, I looked into the model’s housing budget allocations for the cities that I’ve lived in, and they’re not unreasonable (>$1,500/month for a single adult in Boston and ~$1,000/month for a single adult in Richmond), so I think the model’s “living wage” allows for a family to live in reasonable comfort (definitely more than the current minimum wage).
Professor Glasmeier’s model gives a variety of “living wages” depending on family sizes and situations. For the purpose of this article, I choose to use the “living wage” of $16.54 for a family of four with two working adults and two children. This is a standardized minimum wage for the entire United States.
Comparing the Living Wage to Current Minimum Wages and Proposals
So right off the bat, $16.54 is higher than both minimum wage proposals. It’s a lot higher (65%) than the Republican proposal, and slightly higher (10%) than the Democratic proposal. But like I said, the cost-of-living varies across the United States. Could it be that $15/hr is enough for some of us? In some places, rent might even be cheap enough for $10/hr to be sufficient. In order to look into this, I collected Purchasing Power Parity (PPP) data — PPP is just a way to measure cost-of-living — for Metropolitan Statistical Areas (aka cities) across the United States and made cost-of-living adjustments for the “living wage” across the United States. Below is the result for 384 cities in the United States ranging from New York City to Walla Walla, Washington, as well as the rest of the United States who does not live in an MSA (which could also be considered Rural America).
So our first observation — nowhere in the United States is $10/hr enough to constitute a living wage. Our second observation — in larger cities, $15/hr tends to be insufficient for living wage. Only 13% of cities with MSAs larger than 1 million people have living wages below $15/hr, compared to 44% of all cities. We can see this in the following summary table:
Cities where $15/hr was insufficient to support the living wage were 2-3x larger than cities where it was sufficient, and represented 81% of the metropolitan population. Overall, $15/hr would only be sufficient for areas representing about 1/3rd of the American population using the living wage as defined by Professor Glasmeier. Given that these are overwhelmingly small town and rural areas, there are significant racial implications for this as well (these places are overwhelmingly white). In fact, it might counterintuitively be that most of the people who will see the largest benefit from a minimum wage increase could be white, even though whites earn more than minorities on average. In my personal opinion, this is (yet another) strong point for a federal minimum wage pegged to Cost-of-Living, but that’s not the point of this post.
Conclusion
Raising the minimum wage is a contentious topic, but I think almost all Americans agree $7.25/hr is too low. The disconnect lies within how much we should raise it. As we can see, a relatively reliable model puts the “living wage” significantly higher than $7.25 — in fact, the living wage seems to be even higher than what both parties are proposing.
It’s debatable if the solution is to raise the minimum wage even further beyond $15/hr. In fact, I think it’s probably a bad idea. We can note that 17% of federal minimum wage earners are under 20, and a good chunk of them are likely dependents. Even further, 41% of minimum wage earners are single, never-married people. Recall that our living wage of $16.54 was for a family of 4 with 2 working adults, so it includes extra costs like full-time child-care, which is not cheap. In the living wage model, the living wage for a single adult is roughly 75% the living wage for a family of 4. All of this points to the distortionary effects of further raising the minimum wage likely outweighing any potential costs.
It’s important to remember, that there other, more precise ways to increase income to those who need it that work complementary to minimum wage increases. A popular alternative is an Earned Income Tax Credit (EITC), which changes based on circumstances like the number of dependents in a family or whether you’re disabled
This was a tough post to write. It took me quite a few weeks – the underlying charts were actually ready in mid-February. I kept losing scope of the post, and I still feel like my thoughts are jumbled and incoherent here. But I’m ready to be done with this post so I can move on to other topics. So here you are — I hope you learned something at least. I think at the very least, the COL analysis is somewhat interesting.
Don’t forget to subscribe if you liked the post!
Author’s Note: A few days before publishing this post, I was verifying my data and noticed that Professor Glasmeier has updated her Living Wage Model to account for 2020 data. Anyone who attempts to sanity check my data will notice a significant difference in the living wages as given in my data and the living wages given in the new model. It seems the model has added two new components and some inputs have changed such that living wages have risen across the board by roughly 30-45%. I made the decision to stick with the 2019 living wage for two reasons: (1) As indicated in the linked article, the 2020 figures are still preliminary and (2) this is the first major update to the model since 2010, and I’m inherently skeptical about newly implemented changes before they have been through some sort of peer-review process by the larger community, especially a change that results in an increase in living wage of almost 50% in some cities. This implies the author at some level fundamentally changed her definition of living wage that she had been using for about 15 years. Those wishing to see the implications of the model’s change can apply a roughly 35% adjustment to living wages to my dataset. I will warn that Professor Glasmeier’s updated calculator no longer matches my PPP mapping for the cities in her data — cities rose in living wage incredibly disproportionately. The dataset will become significantly less accurate, and much more of a “rough guess-timate”.


