The 2024 Presidential Election is fast approaching. As the incumbent, Joe Biden has a decided historical advantage. Nonetheless, he faces an abysmal approval rating due to issues like a cost-of-living crisis. Moreover, Biden’s response to the Israel-Palestine conflict has devastated his support among Arab and Muslim Americans — major voting blocs in key swing states like Michigan and Wisconsin.
Given the uncertainty surrounding next year’s election, all eyes were turned to the few states that held elections this year. Among those states was my home state of Virginia, which elected all members of its House and Senate chambers across 140 elections statewide. We can compare this year’s results to key past elections — namely the 2020 Presidential Election (Dem win) and the 2021 Gubernatorial Election (GOP win). Doing so can shed light on larger trends across the country to help us prepare for 2024.
Contents (click to skip to a section):
2021 Gubernatorial Election
The most recent major election in Virginia occurred in 2021, when we elected a Republican governor in a razor thin election. Riding a wave of concern over “parents’ rights”, Glenn Youngkin defeated Terry McAuliffe by nearly 2 percentage points. To many this was a shock. It had been a while since a Republican won a statewide election, and McAuliffe had already served a term as Virginia Governor. Prior to 2023, Democrats had won the last six U.S. Senate elections, the last four Presidential elections, and the last two Gubernatorial elections in the state.
Given this, Virginia Dems have had a reasonable concern of a more permanent “red wave”. Let’s begin by looking at how 2023 results compared to those of 2021. Mobile user? Click here to view the figure. Mouse over individual counties for more information.
The first thing that jumps out is some deep red swings in Central Virginia. This map indicates that places like Fluvanna and Cumberland County experienced 30+% swings towards the GOP.
However, we should pause here to note that elections for State Congress are fundamentally different than federal elections. Primarily, many localities are so deep red/blue that the GOP/Democratic candidate often runs unopposed. On the other hand, there will always be both a Democratic and a Republican candidate for President.
So how can we account for this issue? Luckily for us, Virginia elected all House & Senate seats this year. As a result, each precinct had both a House race and a Senate race. So we can first drop all uncontested elections (defined as elections where one party received 0 votes). Next, we can estimate Dem/GOP vote share at the precinct level using competitive elections only. If both House & Senate elections are competitive for the precinct, we take the average. Finally, if there are no competitive elections for a precinct, we drop the entire county. For more information about this methodology and the reasoning used, click here.
Dropping uncompetitive elections drastically changes the picture. Mobile users click here to view.
This figure suggests a large blue shift compared to 2021. Dems gained ground in the vast majority of counties in Virginia.
Okay, so Dems gained ground across the state. Let’s look to see if they flipped any counties.
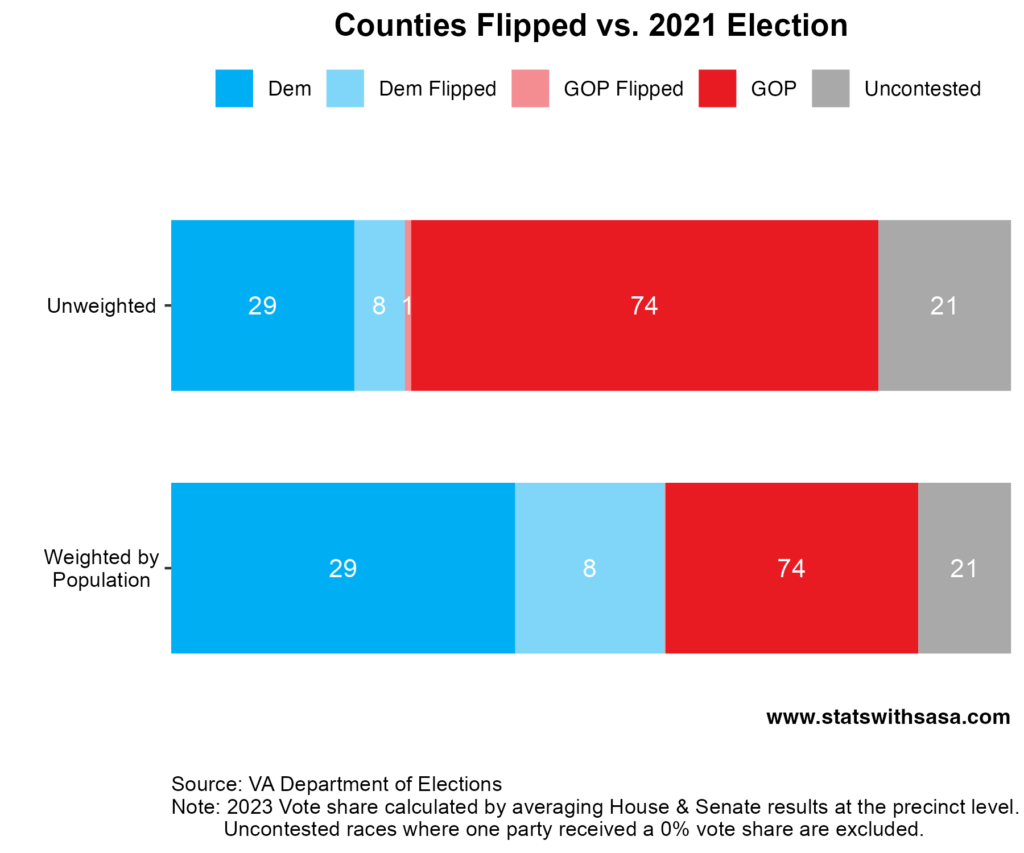
Virginia Dems flipped 8 counties, and lost 1. Reweighing by population illustrates that the Dem-flipped counties are large. Collectively, these 8 counties cast over 500,000 votes in the 2021 Gubernatorial election. In comparison, the county flipped by the GOP has a population of only 10,000 people, and only cast 4,000 votes in the 2021 election.
Finally, let’s analyze the total vote count by party between 2023 and 2021. For the 21 counties with uncompetitive elections, we assume the same vote margins as 2021.
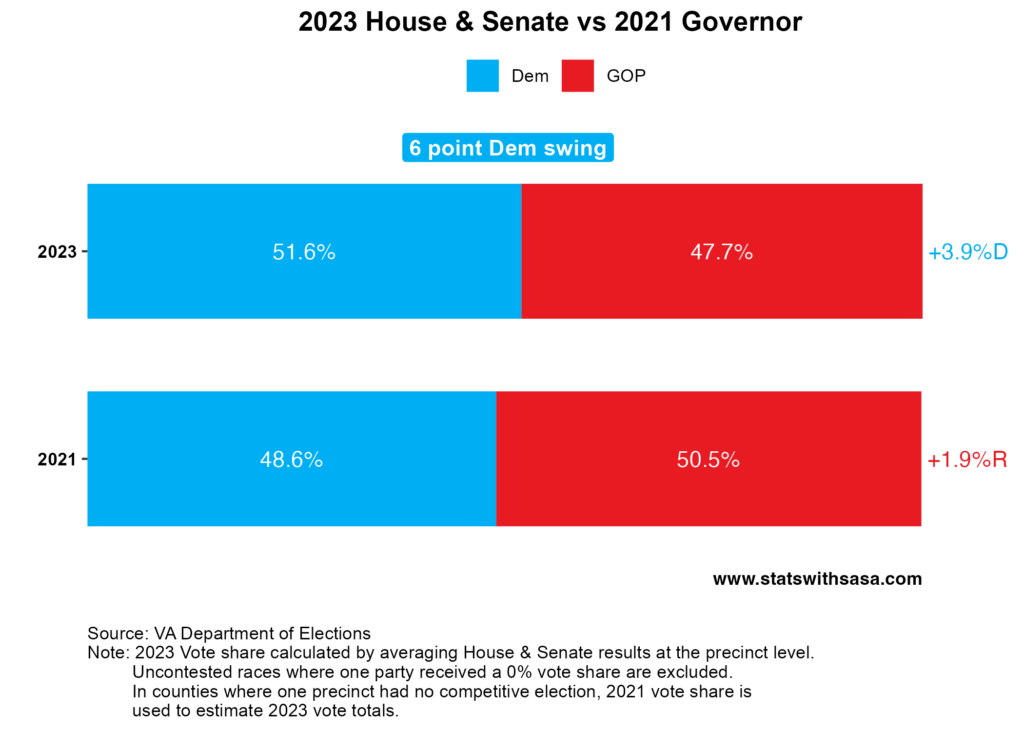
As all the previous figures suggested, Virginia Dems made huge strides compared to 2021. Statewide, I estimate that the Dems gained ~6 percentage points compared to 2021.
2020 Presidential Election
Okay, the Dems did better in Virginia than last time. Ultimately, though, we’re interested in the 2024 Presidential Election. So let’s see how Democrats fared in Virginia versus the 2020 Presidential Election between Biden and Trump. We’ll start with a map of how each vote share changed across counties. Mobile users click here to view.
This map looks different, which might not be wholly unexpected. After all, the Democrats won 2020 and lost 2021. This map suggests that although Dems gained ground compared to 2021, they still performed worse than the last Presidential election.
Looking at which counties flipped tells a similar story:

Here we see that compared to 2020, the GOP flipped 5 counties and lost 1. The five counties flipped by the GOP accounted for over 130k votes in 2020, compared to 9k votes for the one county flipped by Dems.
Analyzing total votes reinforces what we’ve learned so far. This time, we assume 2020 margins for counties that had an uncompetitive election.
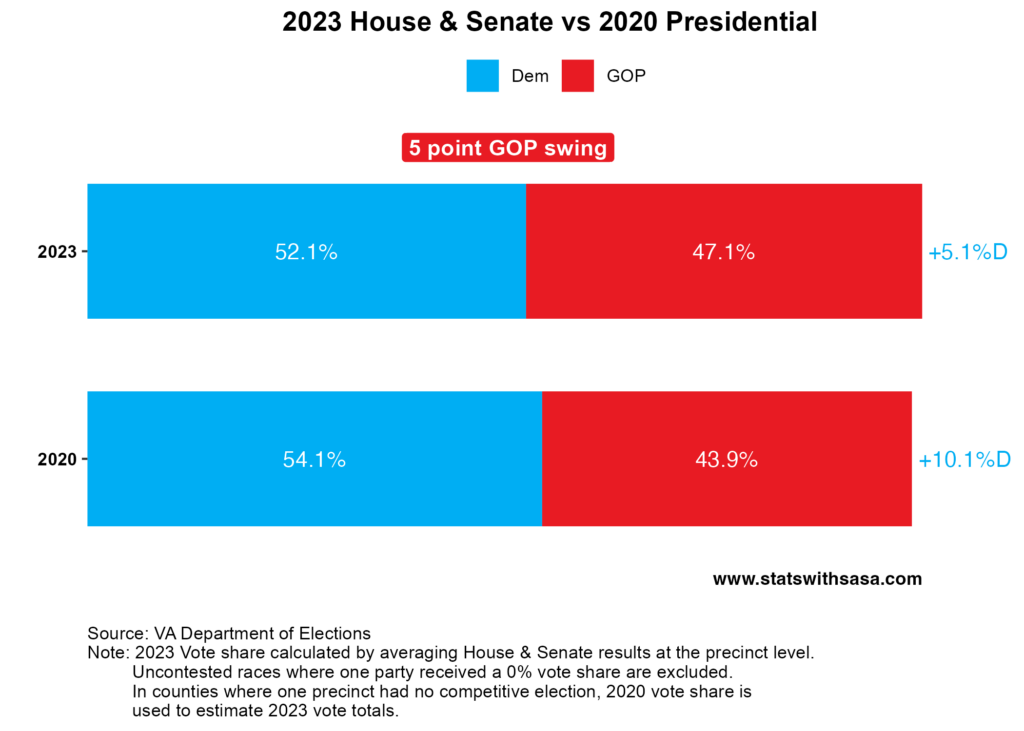
Although Dems “won” in 2023, they performed ~5 percentage points worse than they did in 2020. Note that since Dems did better in 2020 than 2021, assuming 2020 margins for uncontested counties instead of 2021 margins implies a slightly better 2023 performance for Dems.
Summary
After Nov 7th, social media was full of Democrats claiming a blue wave that indicates an incoming Biden victory next year. The real picture is probably not so clear. To paint a full picture, let’s compare vote totals across all the elections we’ve looked at so far. This time, we assume 2021 margins for uncontested counties. This is a conservative assumption in a sense, since it implies a worse Dem performance.
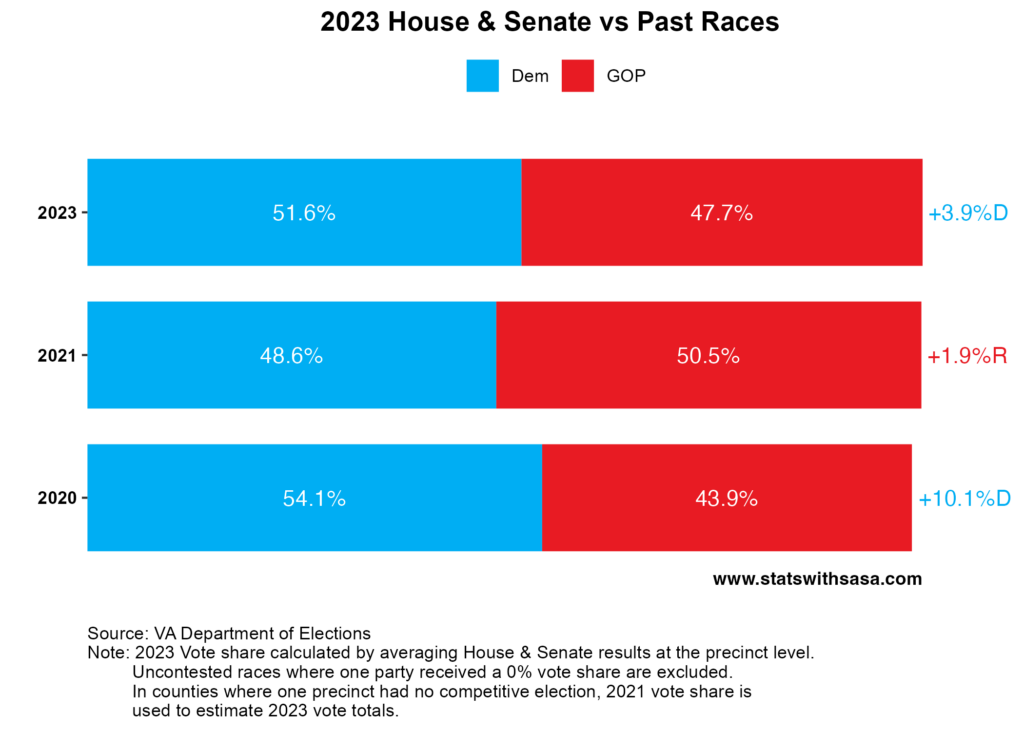
Here we see that Dems have clearly lost ground since 2020. Admittedly, Democrats tend to do best in Presidential elections, so they might do better next year than they did this year. That being said, I find it unlikely that they’ll make up the ~5-6 percentage points they lost compared to 2020. One of the key reasons Democrats tend to do better in Presidential Elections is that their voter base experiences better relative turnout. But, the overturning of Roe v Wade has galvanized Democratic voters and arguably led to better turnout amount Democratic voters than usually expected in a midterm election. As a result, Dems might not experience the “Presidential Election turnout bump” they are accustomed to, because their voters are already turning out to vote.
Ultimately, I really doubt Biden will lose Virginia next year. Virginia hasn’t voted for a Republican president since 2004. Even Hillary won Virginia by more than 5 points. But, even a 3 point nationwide swing versus 2020 will likely wipe out the Dems. Biden won 3 states by less than 1 point, and losing all 3 of them will automatically give Republicans the 2024 election.
At the beginning of this article, I mentioned how President Biden’s unequivocal support of Israel has wiped out his support among Arab and Muslim Americans, who comprise large voting blocs in some of those states that Biden barely won last time. Stay tuned for an article that I’ve been working on regarding this, where I’m using demographic data to estimate the impact that losing Arab & Muslim support will have in swing states. If you haven’t already, feel free to subscribe to my newsletter to get notifications when a new article drops.
Conclusion
Due to the unfortunate nature of our electoral college system, Joe Biden’s chances in 2024 are precarious. Even though he won the popular vote time by 4.5 points, even a 1 point swing in some key states might cause him to lose the election. In my (unprofessional) opinion, Democrats have some major uphill work for them in swing states. They can’t afford to get complacent with their incumbent advantage, because all signs are pointing towards next year’s election being anyone’s to win.
So we might see someone win an election from jail. Unfortunately for my fellow Virginians, we’ve seen this before, and it usually ends poorly.
Don’t forget to subscribe to my blog. I only email when a new article drops!
Methodology
The analysis underlying this blog post was a little more complicated than usual. Here I’ll talk a little more about it.
The most complex part of this analysis is how I dropped uncontested elections. I performed all calculations at the precinct-level. We can consider 4 possible scenario for a precinct. Recall that a “competitive” election is defined as an election where both major parties receive votes:
Scenario 1: Both House & Senate races are competitive.
In this scenario, we average House & Senate results for all precincts without issue:
![\[ demshare_{county} = \frac{\sum_i{dem_{house} + dem_{senate}}}{\sum_i{total_{house} + total_{senate}}} \]](https://www.statswithsasa.com/wp-content/ql-cache/quicklatex.com-4b8f6d718ac987de728b6420fdef4f3b_l3.png "Rendered by QuickLaTeX.com")
![\[ \frac{dem_{house}}{total_{house}}*(total_{house} + total_{senate})} \]](https://www.statswithsasa.com/wp-content/ql-cache/quicklatex.com-a36fb408dc59fea93016cfd7102a1a36_l3.png "Rendered by QuickLaTeX.com")
![\[ \frac{dem_{senate}}{total_{senate}}*(total_{house} + total_{senate})} \]](https://www.statswithsasa.com/wp-content/ql-cache/quicklatex.com-add3b3b64a4a204d8ab66715efcb615f_l3.png "Rendered by QuickLaTeX.com")