This page is for the 2024 NCAA Tournament. See here for the updated analysis for 2025.
Another year, another March Madness. As we scramble to fill out our yearly brackets, it’s important to keep injuries in mind. For example, did you know that No. 2 Seed Marquette has 3 players currently listed as injured? And that those 3 players account for over 37% of the points that Marquette has scored so far this year?
In this post, I attempt to statistically evaluate the injuries of each NCAA Tournament team. I gathered player statistics from ESPN and injury data from Rotowire, and examined three basic metrics to assess the “injury level” of each team. I pulled injury data as of Sunday, March 17, 2024.
Article guide (click to skip ahead):
- March Madness injuries
- Minutes-based metric
- Points-based metric
- Composite Injury Score
- Potential upset candidates
- Does injury level matter?
- Conclusion
March Madness Injuries
Minutes Based Metric
First, we can look at how many total season minutes that currently injured players played throughout the season. To do so, we can simply sum the minutes played by currently injured players (i.e. before injury) and divide by the total number of minutes played by the team. A higher percentage indicates that players that normally play a lot of minutes have been injured. Teams with high percentages may struggle to adjust lineups in the tournament to compensate, as they are not used to playing without these injured players.
I’ll pause here to note that I have two injury “types” in my analysis: Game Time Decision (GTD) and Out. My charts give a breakdown of these injury types, but it’s entirely possible some of these GTD designated players could return in time for their tournament games.
The following chart shows the results of my minutes-based analysis:

Here we see 3 teams most impacted by injuries in our minutes-based metric: Marquette (No. 2), Texas Tech (No. 6), and Kansas (No. 4). It might not be that surprising to see Kansas on this list — they are currently reeling from back-to-back 20+ point losses for the first time since 1919. These three teams are also high seeds, indicating that they could be primed for an upset in the opening weekend.
Points Based Metric
Although minutes are a useful yardstick to see how injured a team is, we may be more interested in the productivity of each injured player. In other words, how much did each injured player score this season? After all, basketball at the end of the day is about scoring buckets (RIP). To look at this, we can simply sum the total points scored by currently injured players and divide by the total points scored by the team this season.
A higher percentage indicates that players that normally score a lot of points have been injured. Teams with high percentages may struggle to find scoring power in the tournament.

Again, we see the same 3 teams most impacted by injuries. Although, the magnitude of impact for Kansas and Marquette in particular is astounding. Currently injured players accounted for over 37% of Marquette’s points this season. And they accounted for a whopping 42.9% of Kansas’ points scored this season. No wonder Kansas has suffered the worst back-to-back losses in over 100 years.
Composite Injury Score
Okay, so let’s put together our two metrics to get a better idea of the full picture. To do so, I created a simple Composite Injury Score by normalizing each metric, and taking the average of the result. This score is constructed to be between 0 and 100, with 100 being the worst possible score (i.e. “Most Injured”).
A chart summarizing the Composite Injury Score can be found below. This chart breaks down which portion of the score comes from the Minutes-based metric, and which portion comes from the Points-based metric.

Here we see that Kansas and Marquette are neck-and-neck as the most injured teams in the tournament this year. Texas Tech is not far behind. In conclusion:
Kansas and Marquette are by far most impacted injured teams going into the tournament, with Texas Tech not far behind. These are all higher seeds that may be primed for an opening weekend upset.
Potential Upset Candidates
Now let’s look at potential upset candidates. Are there any First Round games where the lower seeded team is much less injured than the higher seeded team? We can look at games where the lower seeded team has an Injury Score 25 points (or more) less than the higher seeded team.
As you may have expected, we see Marquette, Kansas, and Texas Tech as prime upset candidates. Houston and Nebraska appear on this list as well, but I should point out that 1-16 upsets are exceedingly rare, so I wouldn’t bet on it.
Note: This is a very simple check for upsets that is entirely based off relative injury status of each team. The next section talks a little bit about the impact of my injury score.
Does Injury Level Matter?
In short: I don’t know. I’ve been doing this analysis for 3 years now, so we can look at last year’s March Madness results to assess my Composite Injury Score (with a very limited sample size).
We will focus on everyone’s favorite part about March Madness: upsets. Nobody really considers a 9-seed beating an 8-seed an “upset”. So I define an “upset” as a game where there is more than a 2-seed difference between the teams. Obviously, the higher seeded team also has to actually win.

By my definition, there were 14 upsets last year. Of those, 11 games had at least one player with an injury (moving forward, all charts only look at games where at least one player is injured). The majority of these games (64%) occurred when the underdog was less injured than the higher seed. Of course, the sample size here is extremely small, but it does give some evidence that injury level plays a factor in upsets.
We can also look at the upset rate of the low seeded teams, split by if they were more or less injured than their opponent.

Here we have a slightly larger sample size (note: I only consider games where an “upset” is possible, so the teams must be >2 seeds away from each other). When they are the less injured team, lower seeds have a slightly higher upset rate than when they are the more injured team.
But not all upsets are created equal. It’s exceedingly rare to see a 1-16 or 2-15 seed upset (although we did see two of them last year). So let’s exclude these games from consideration.
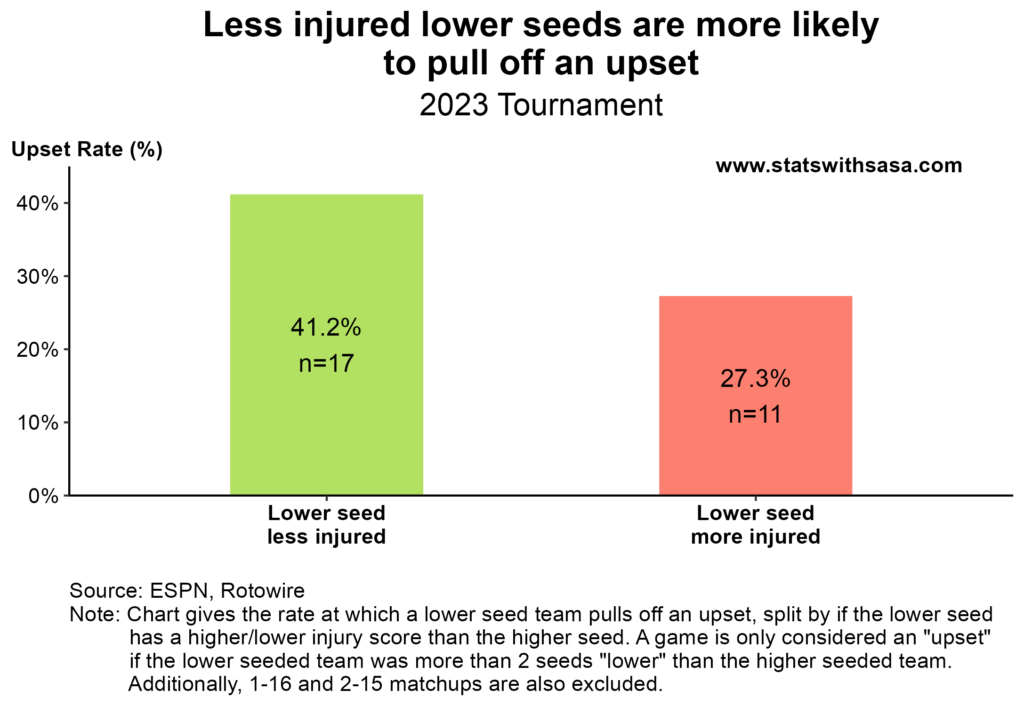
The results here are much more stark. Lower seeds are almost twice as likely to pull off an upset when they are less injured than the opposing team.
Conclusion
Thanks for reading! I hope that this article helps you win your bracket challenges. If you have any questions or suggestions about my methodology, feel free to drop a comment below or contact me. I am always happy to hear (constructive) criticism.
If you like this article, consider subscribing below.