As we scramble to fill out our yearly brackets, it’s important to keep injuries in mind. For example, 5-seed Texas Tech has two players with an injury designation. Together, these two players account for over 35% of points scored by Texas Tech this season. And we all know that 5-seed upsets are particularly popular in the first round of March Madness.
In this post, I attempt to statistically evaluate the injuries of each NCAA Tournament team. I gathered player statistics from ESPN and injury data from Rotowire, and examined three basic metrics to assess the “injury level” of each team.
I pulled injury data as of Monday, March 17, 2026. This year, I will be updating this article periodically before brackets lock. So be sure to check back before you finalize your brackets!
Note: This analysis includes all players that are out for any reason — not just injuries. That includes things like arrests.
Click to jump ahead
- Minutes-based metric
- Points-based metric
- Composite Injury Score
- Matchups with the biggest injury differential
- Full downloadable data
Minutes Based Metric
First, we’ll look at how many total season minutes that currently injured players account for. To do so, we can simply sum the minutes played by currently injured players this season (before injury) and divide by the total number of minutes played by the team. A higher percentage indicates that players that normally play a lot of minutes have been injured. Teams with high percentages may struggle, as they’re not used to playing without these injured players.
I’ll pause here to note that there are two injury “types” in my analysis: Game Time Decision (GTD) and Out. My charts give a breakdown by these injury types, but it’s entirely possible some of these GTD designated players could return in time for their tournament games (but they may be hobbled!).
The following chart shows the results of my minutes-based analysis:
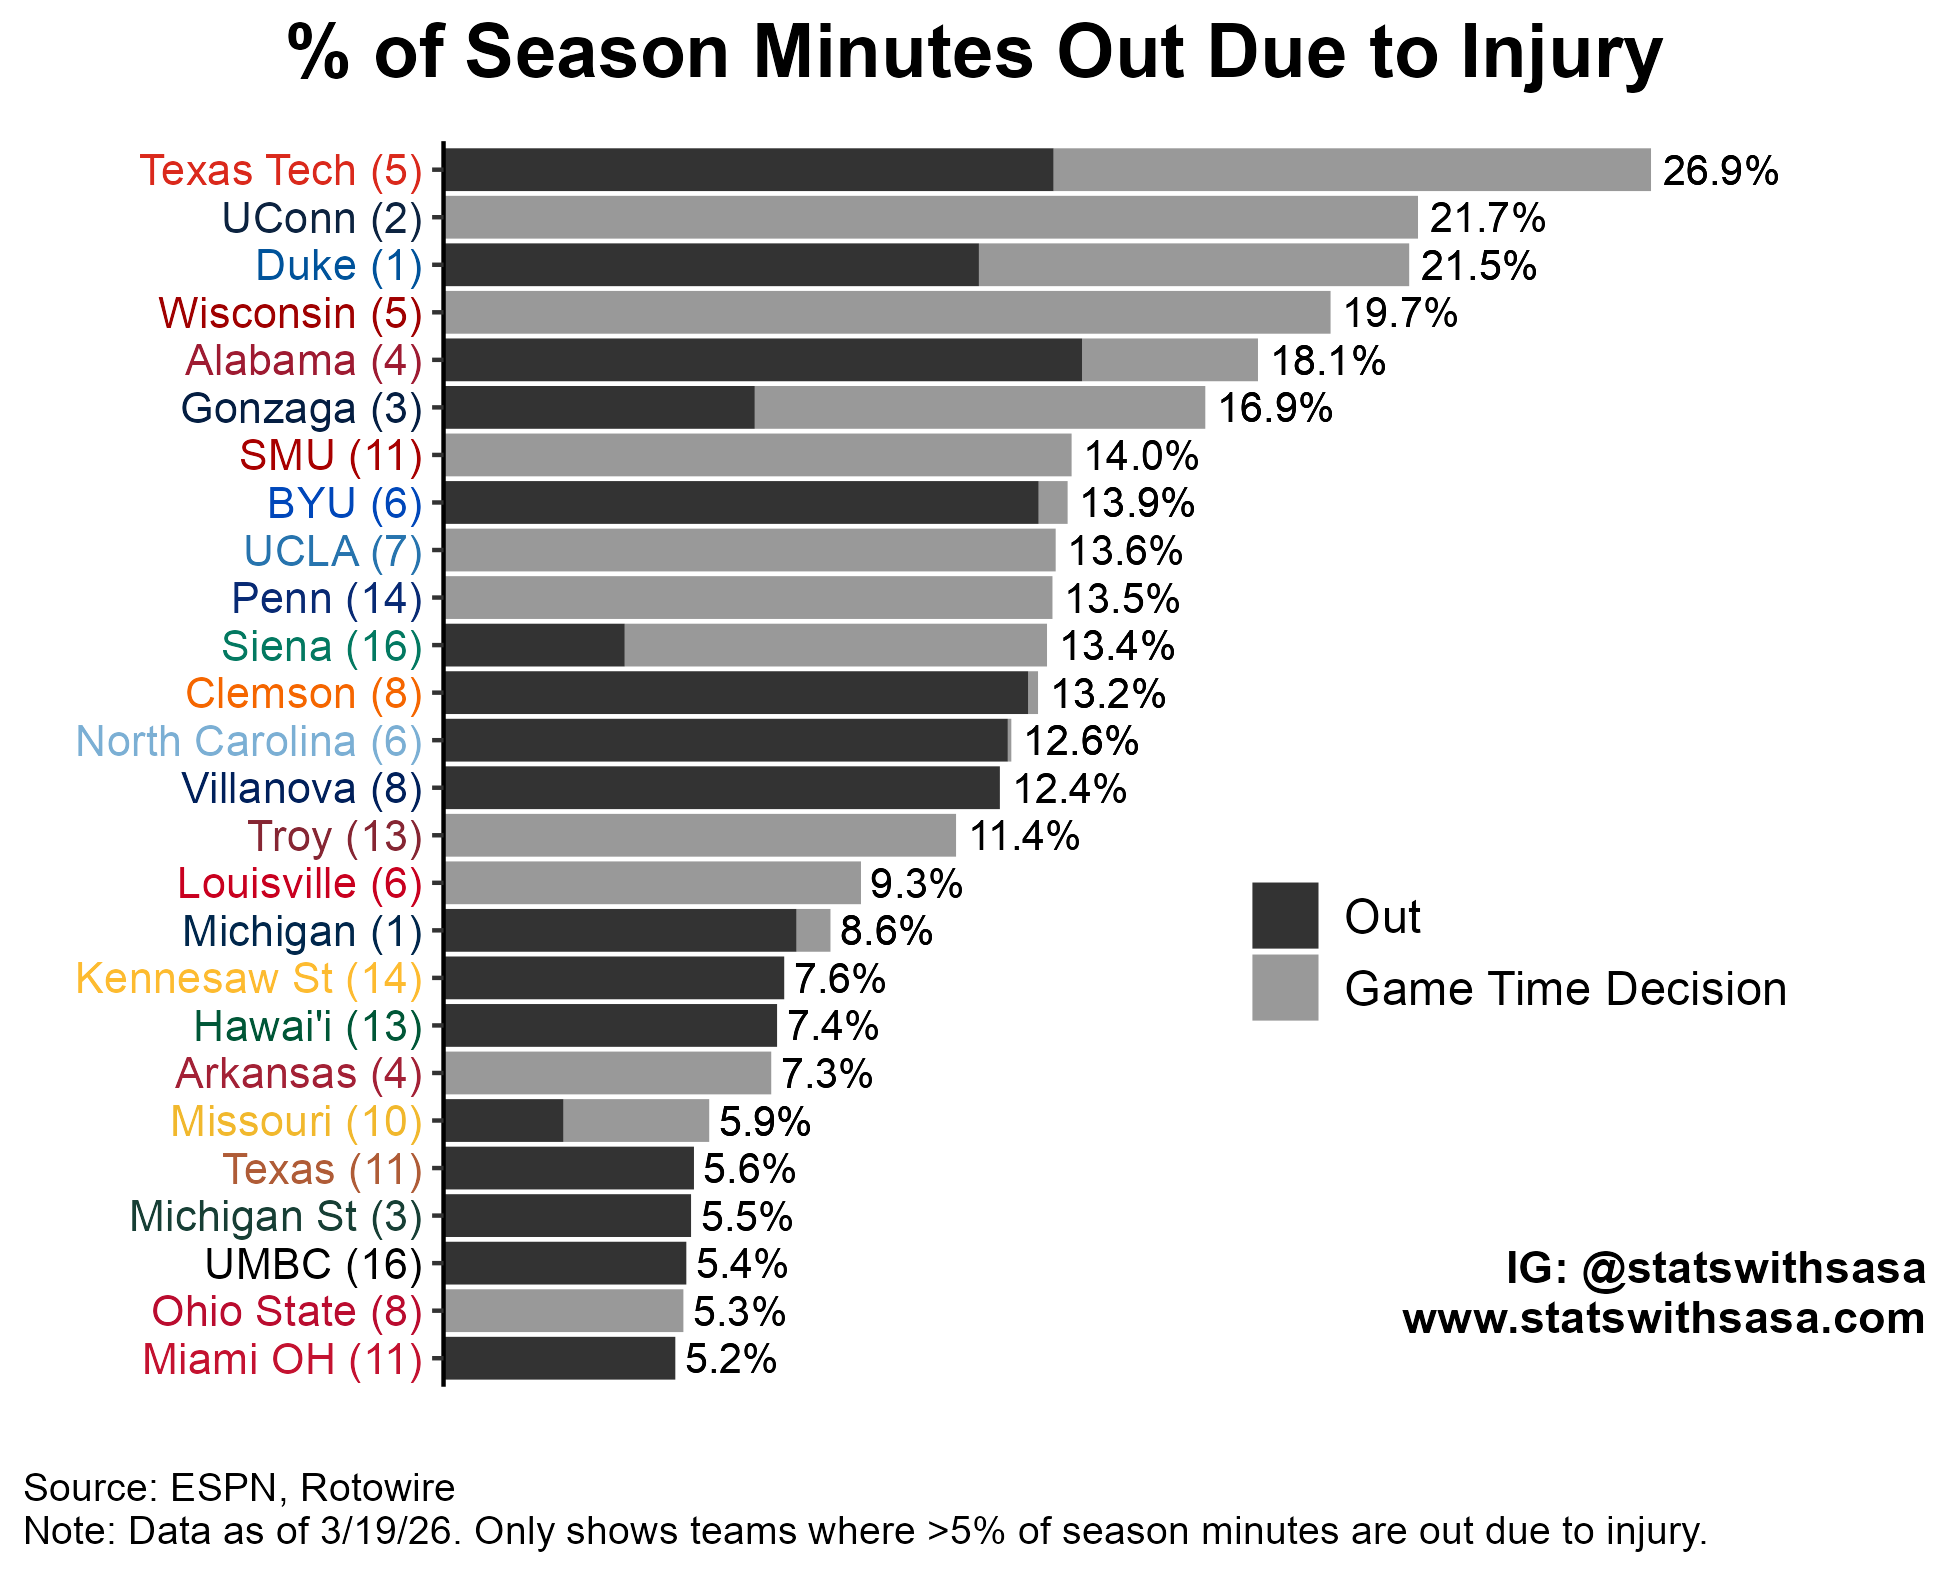
It looks like Texas Tech (5), UConn (2), and Duke (1) are particularly affected by injuries going into the tournament. Interestingly, Texas Tech and Duke were both in the top 3 most injured teams last year as well.
Points Based Metric
Although minutes are a useful yardstick to see how injured a team is, we may be more interested in the productivity of each injured player. In other words, how much did each injured player score this season when not injured? After all, this game has always been about buckets. To look at this, we can simply sum the total points scored by currently injured players (before injury) and divide by the total points scored by the team this season.
A higher percentage indicates that players that normally score a lot of points have been injured. Teams with high percentages may struggle to find scoring power in the tournament.
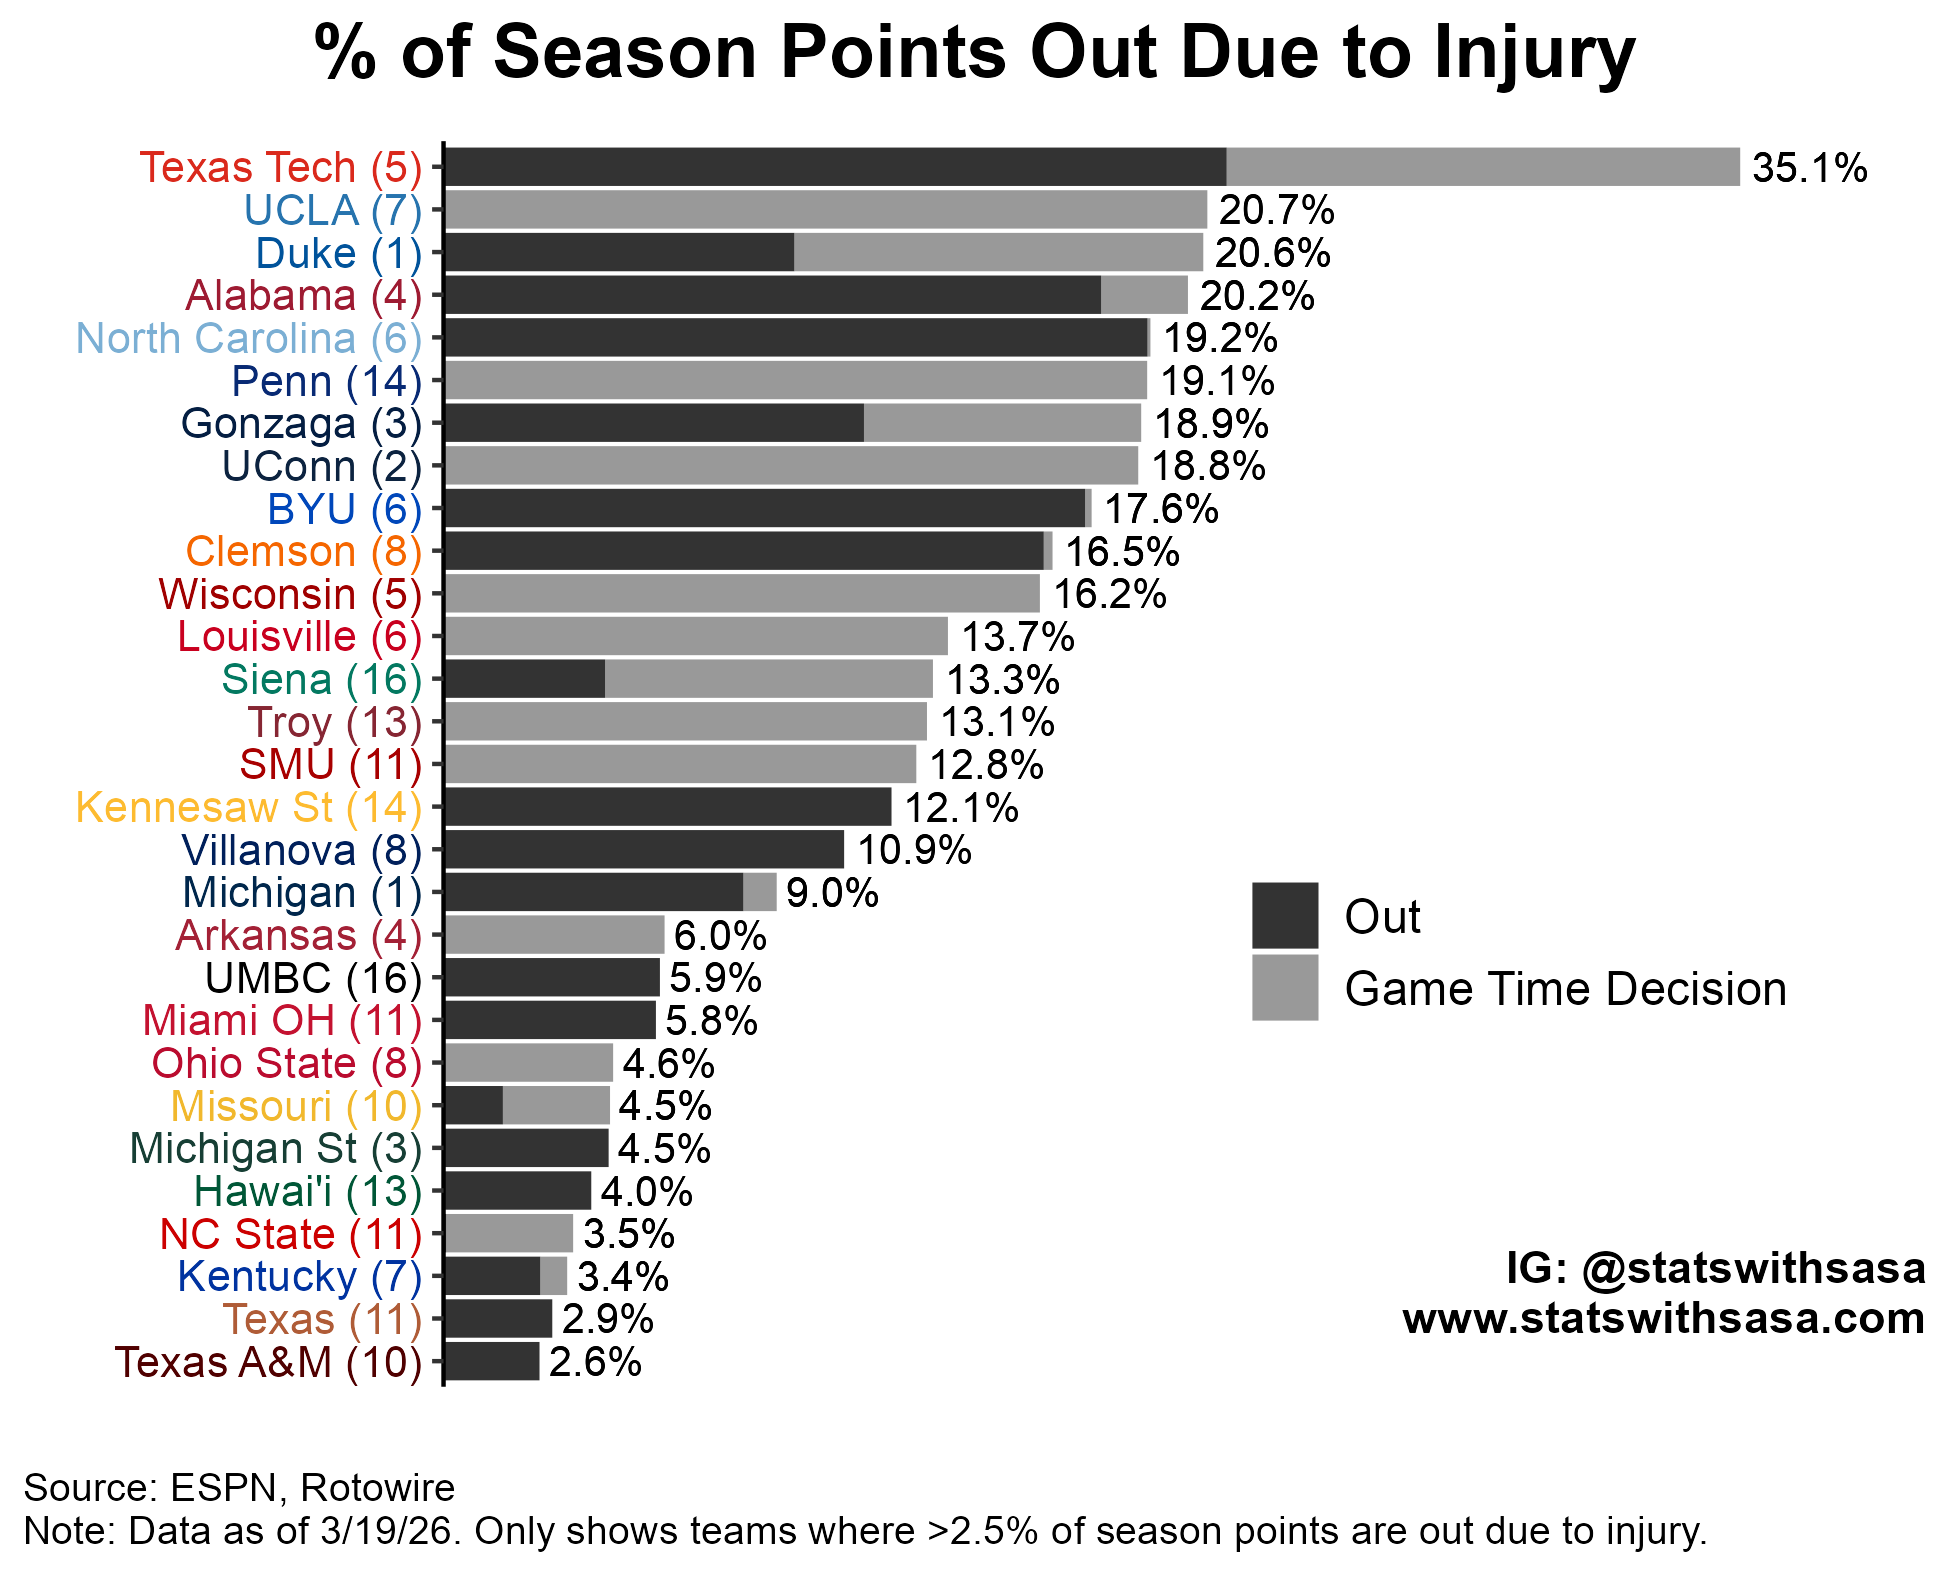
It looks like UNC (6) and Penn (14) in particular have injuries to high scoring players, even if those players accounted for comparatively fewer season minutes. Texas Tech again stands out at the top of the chart.
Composite Injury Score
Minutes and Points aren’t the only important things that a player contributes to a team. There are other important aspects to basketball — things like rebounds and assists are also meaningful. To better account for the overall impact of injured players, I created a Composite Injury Score. This score takes into account: Minutes, Points, Rebounds, Assists, Steals, and Blocks. See here for more information on how this score was calculated. The Composite Injury Score is constructed to be between 0 and 100, with 100 being the worst possible score (i.e. “Most Injured Team”).
For this score, I ignored the distinction between the “Game Time Decision” and “Out” injury distinction. The results can be seen below:
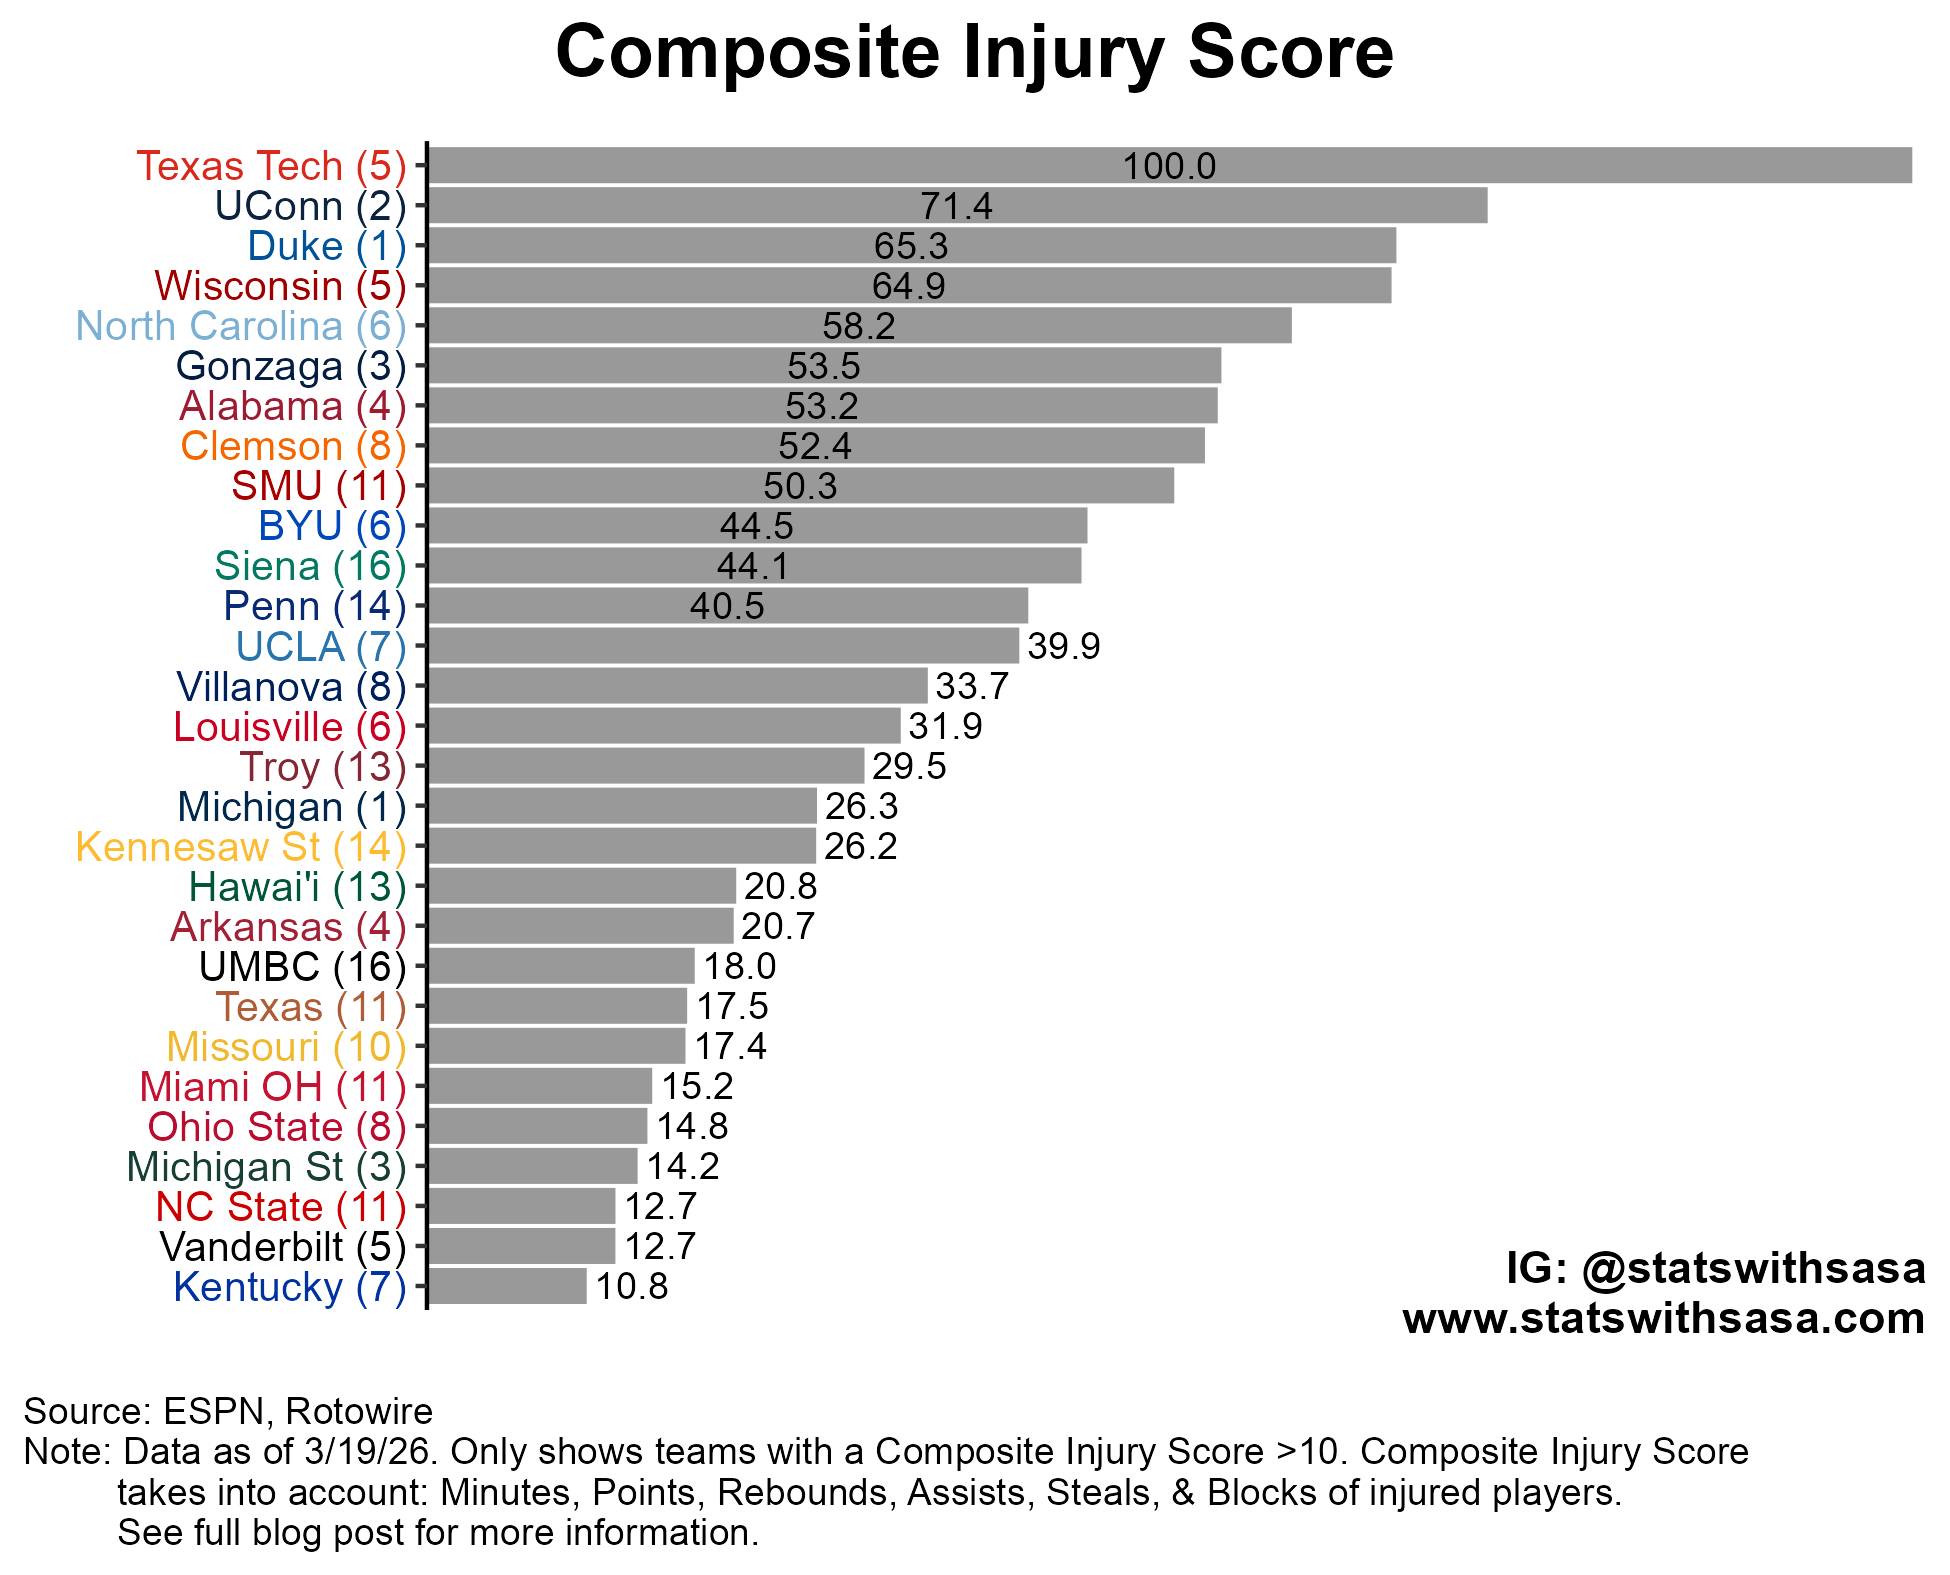
According to my Composite Injury Score, Texas Tech (5), UConn (2), Wisconsin (5), and Duke (1) are most heavily impacted by injuries going into the tournament.
Interestingly, Texas Tech and Wisconsin are both 5-seeds and may be primed for that traditional first round 5-seed upset.
Matchups with the biggest injury differential
Now that we’ve calculated a Composite Injury Score that takes into account multiple dimensions, let’s take a look at which first-round matchups have the biggest Composite Injury Score differential. The following table gives each first-round matchup and the Composite Injury Score of each team. You can then sort by which matchup has the biggest differential between each team’s Composite Injury Score.
Full Data
You can find the the full data for all teams in a searchable table below. You can also download this data for your own uses.
I hope you enjoyed my yearly march madness injury article! If you liked it, consider subscribing below.