Note: This article is outdated. Please see here for the current iteration for the 2023 Tournament.
As March Madness begins and we scramble to fill out our brackets, an interesting and important thing to keep in mind is injuries – especially injuries to key players. A simple approach to dealing with this is to just look up the injury report for each team as you’re making your picks.
But what if we took things a step further and statistically looked at how player injuries might impact each team? To that end, I collected data on player minutes and other statistics from ESPN to calculate two metrics for each tourney team:
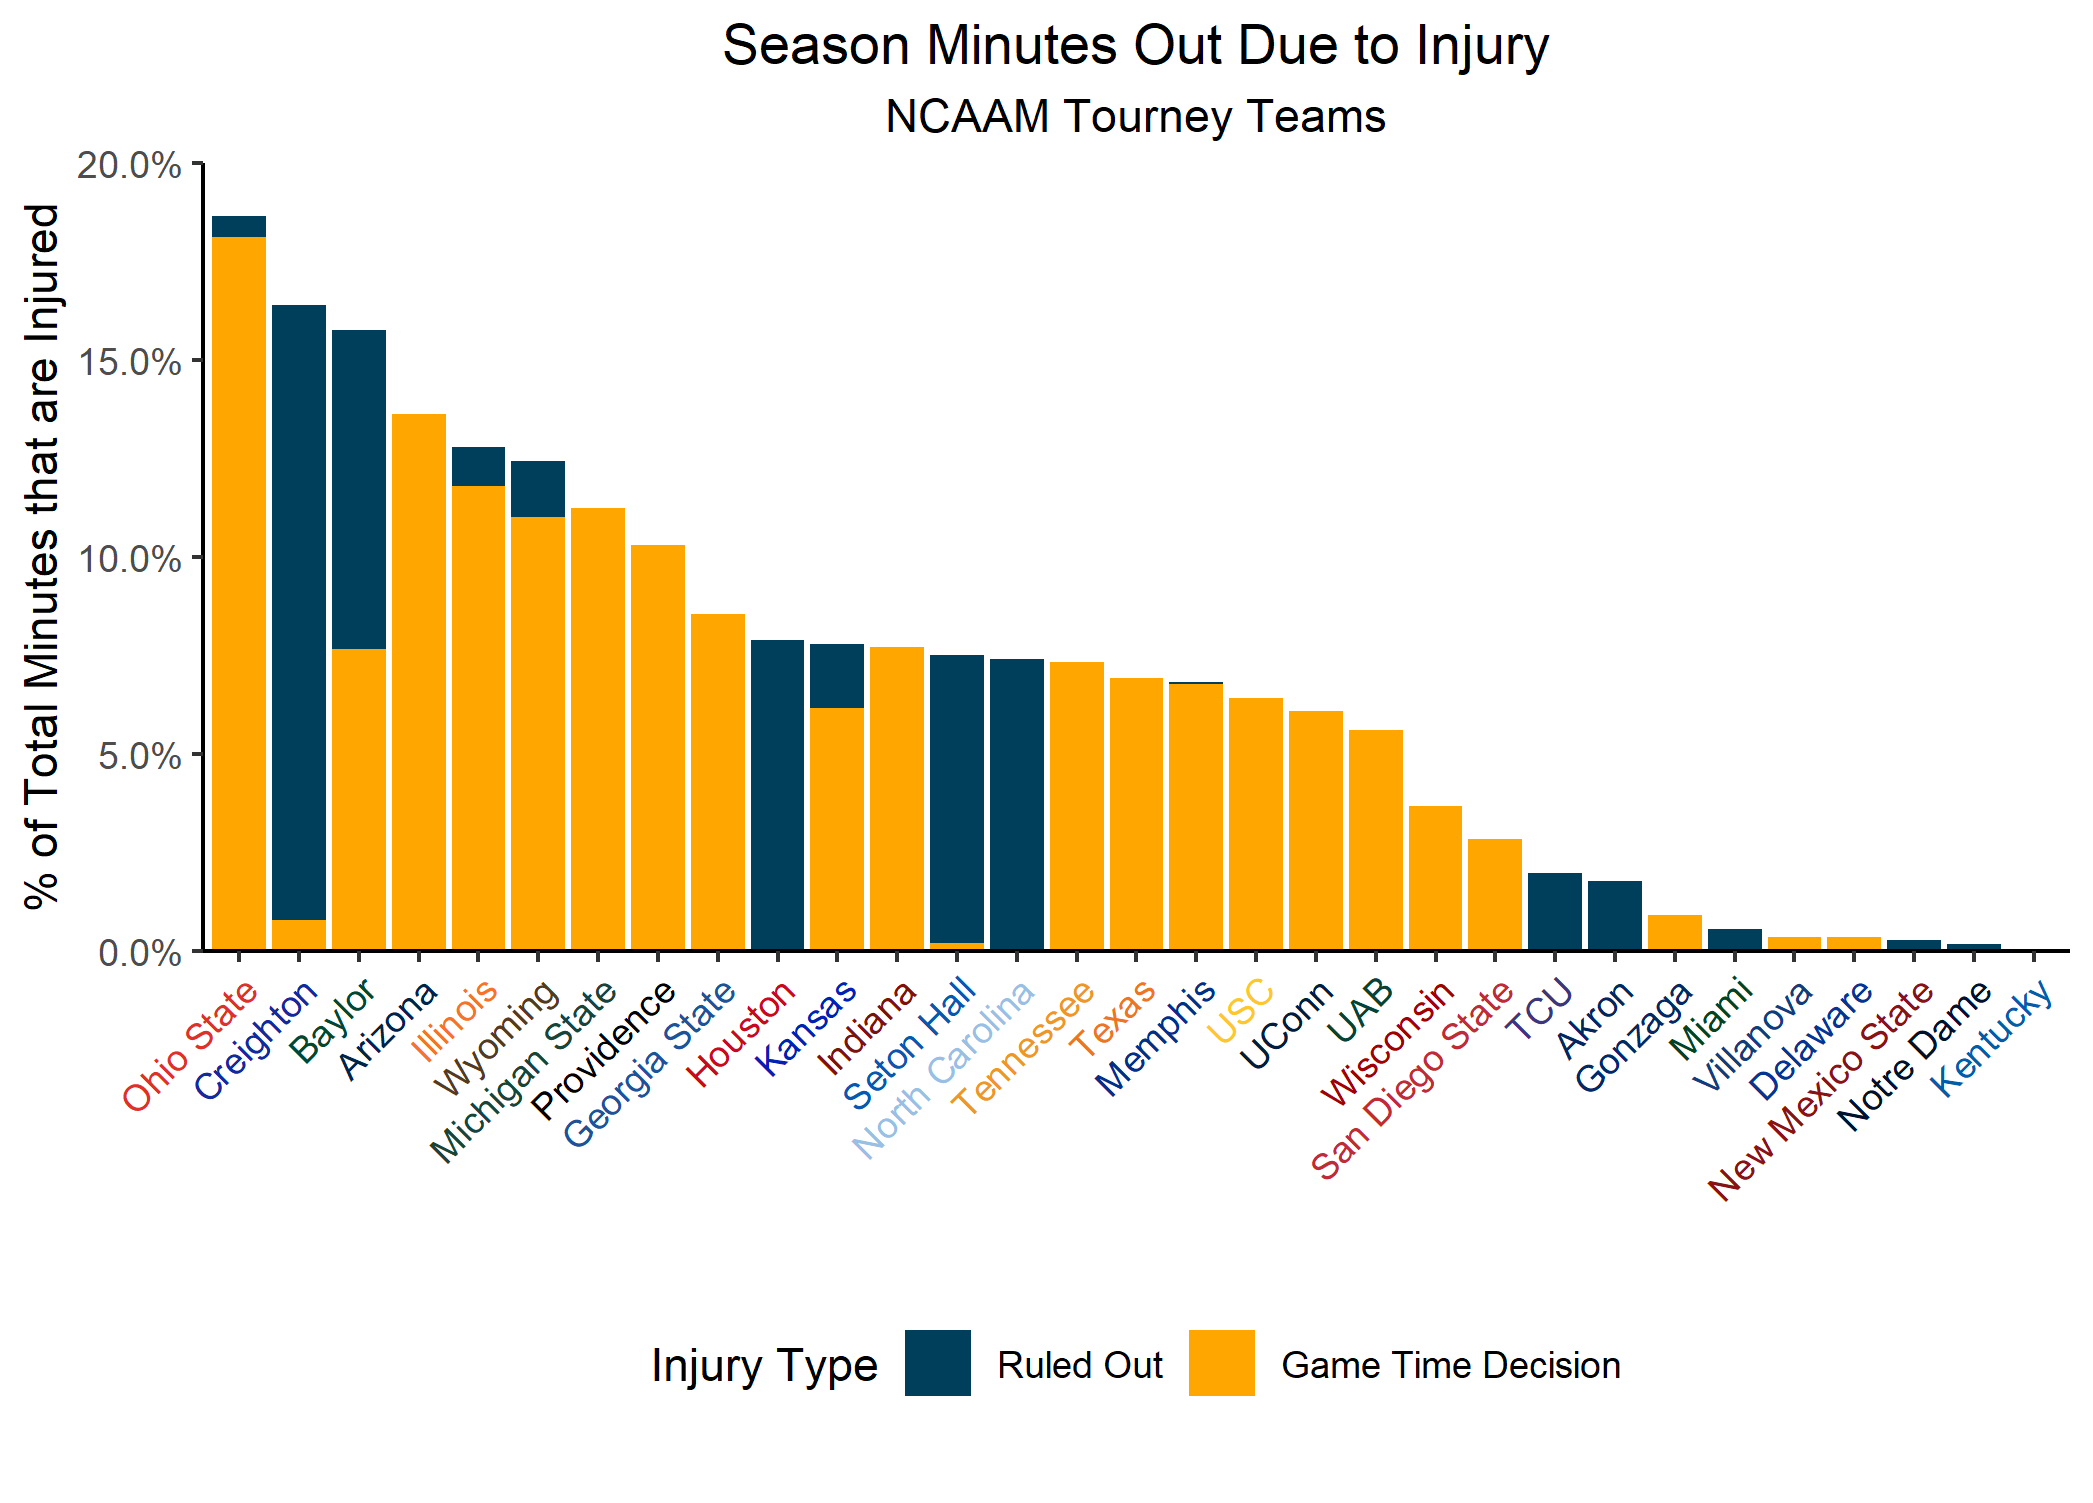
- The % of total season minutes that currently injured players accounted for
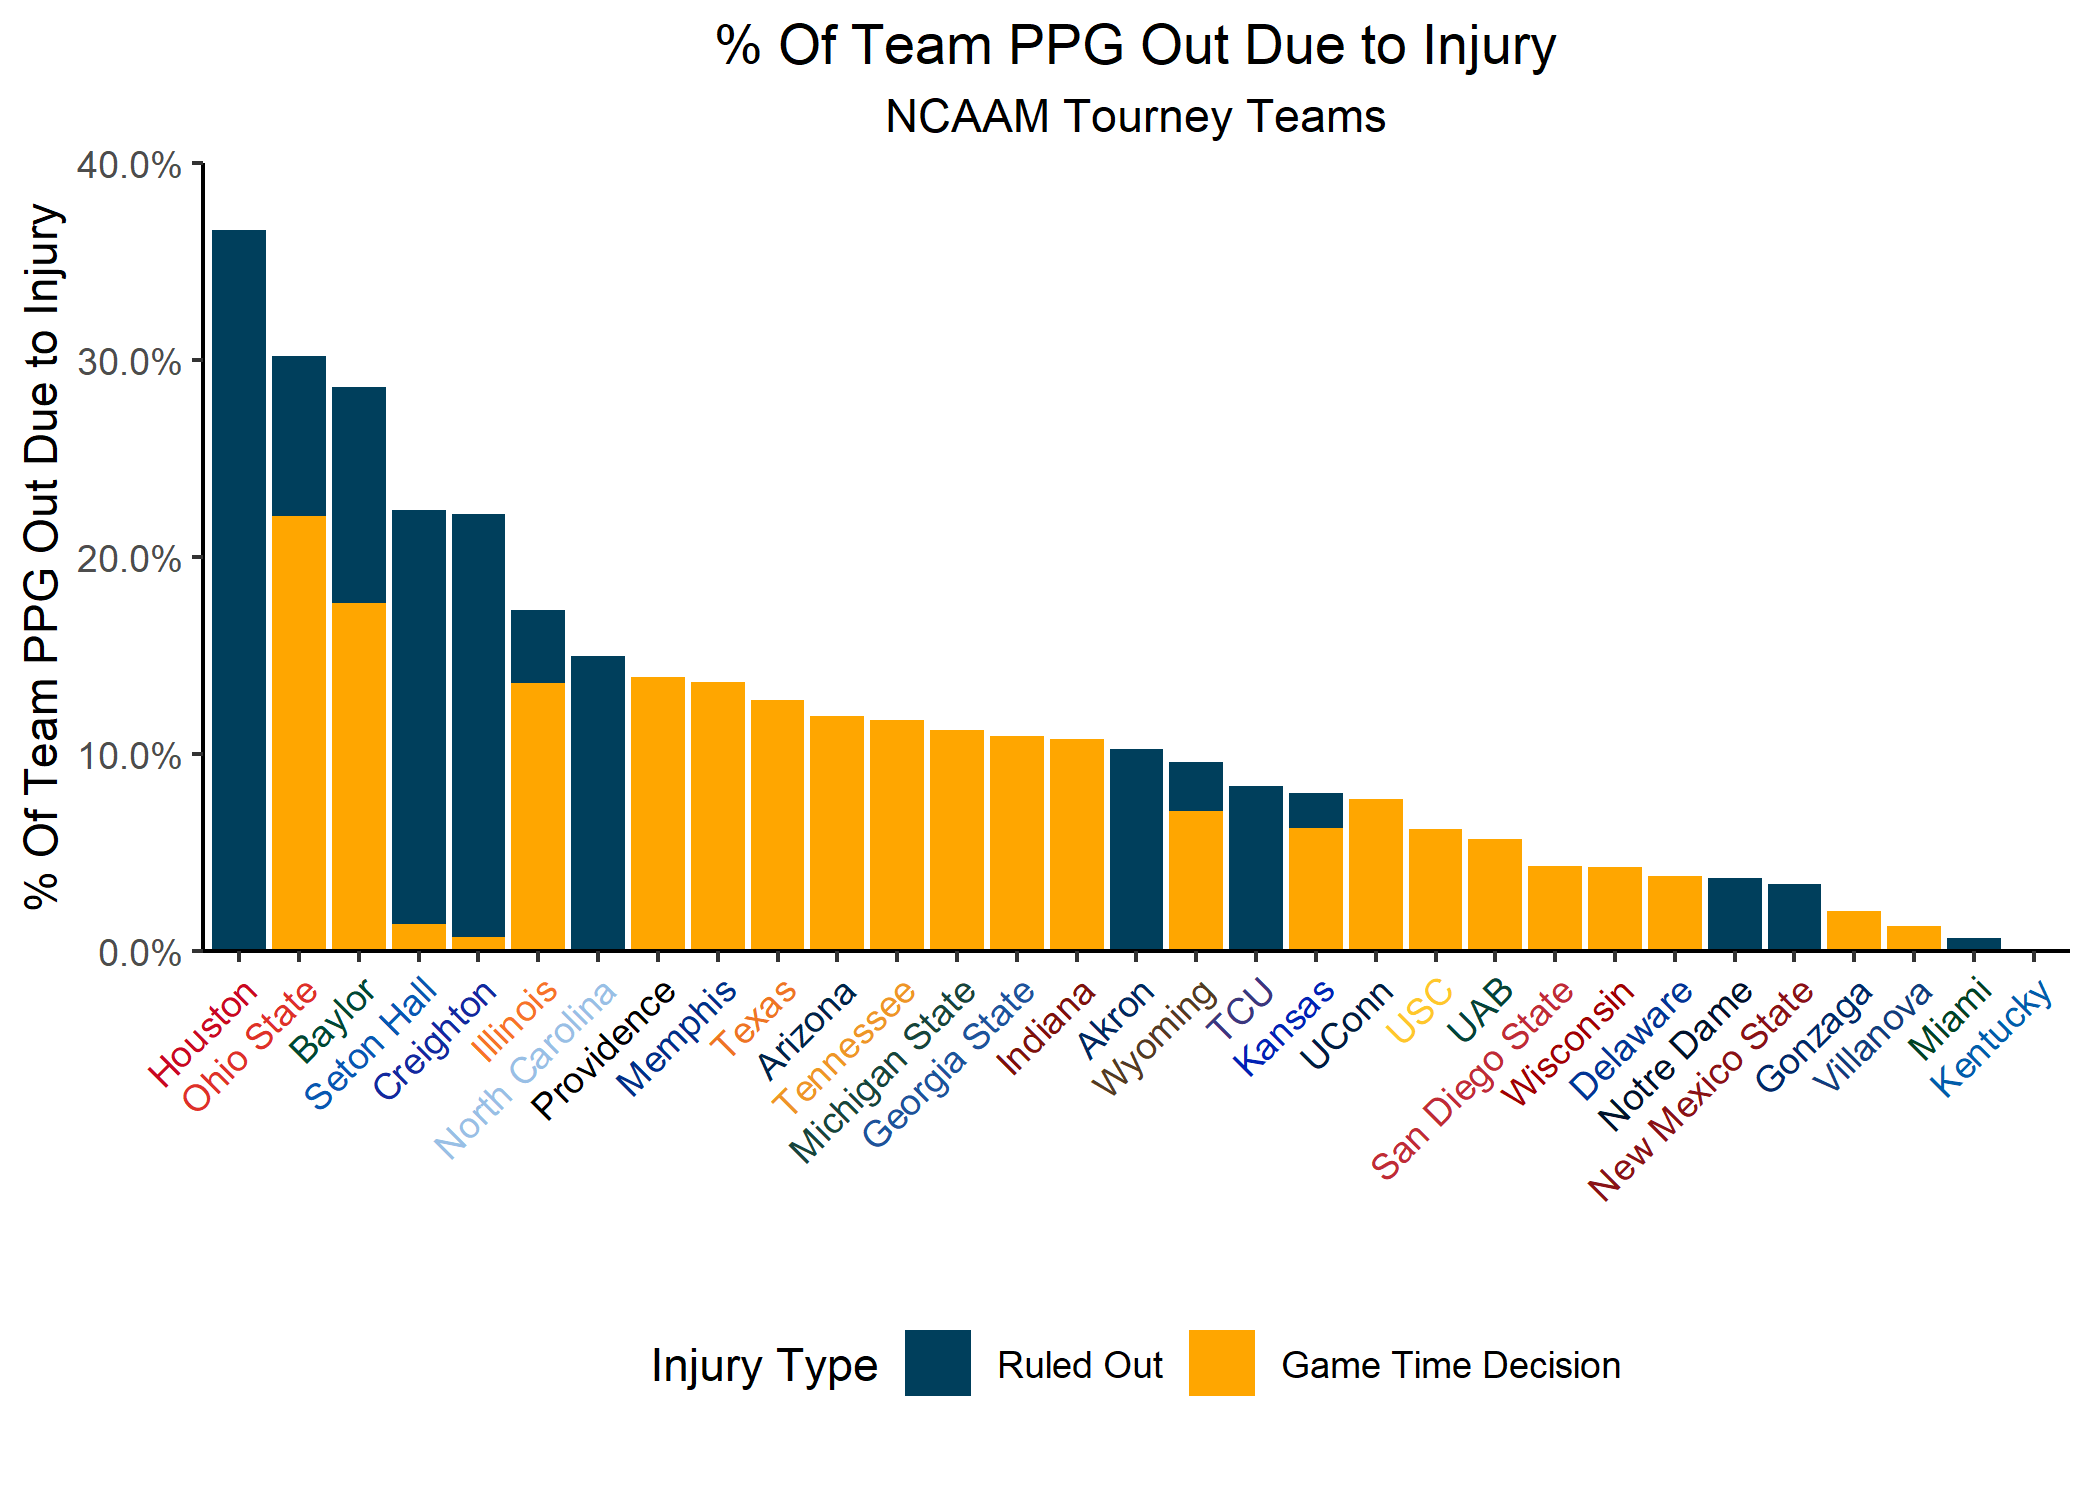
- The average PPG of injured players as a % of the team average PPG
Furthermore, we might want to take into account reported injured players might have a chance to play in the tournament. Based on the source I used, injured players can be separated into two groups: Game Time Decision (GTD) or Ruled Out.
Note: This post only mentions teams that have at least 1 injured player. If a team is omitted, it is because the team has no players listed on its injury report.
Minutes
A chart illustrating the results of the first metric can be found below:

The full results can be found below:
Points
A chart illustrating the results of the second metric can be found below. Note that while this metric helps contextualize the impact of injured players, it should not be interpreted as a suggestion that Team X will score y% fewer points due to injuries.

The full results can be found below:
Composite Score
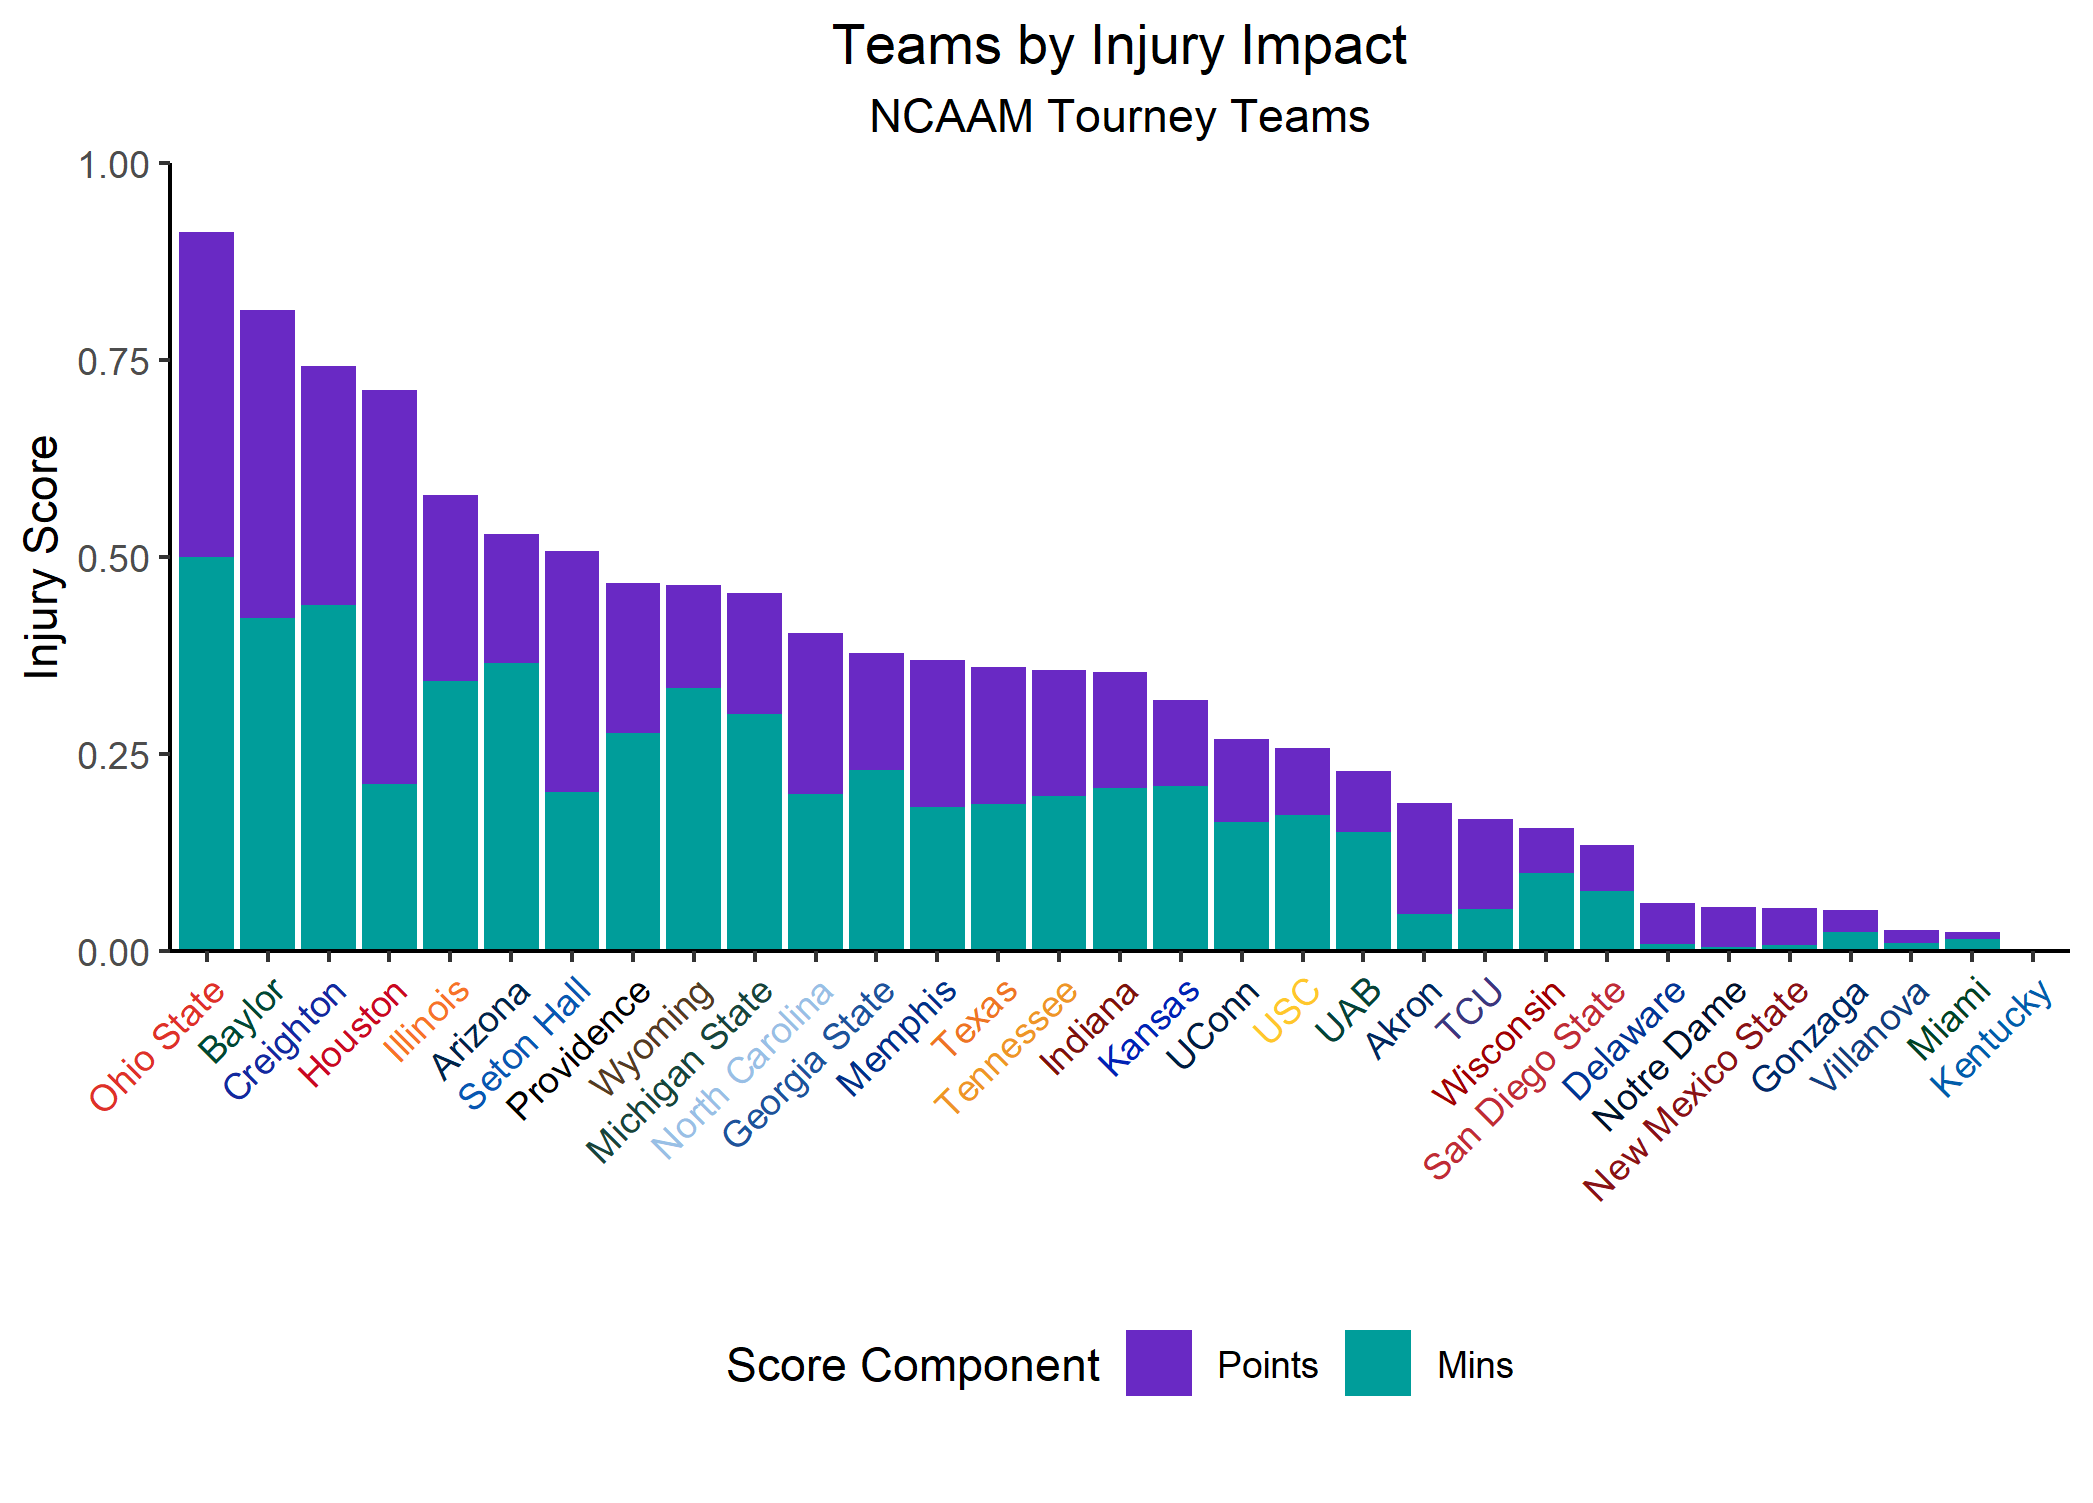
We might also be interested in combining these two correlated, but different metrics to get a better idea of the full picture. To do that, I created a simple “composite score” by normalizing each variable (using Min-Max Normalization) and taking the average of the result. Since I took the mean of these normalized variables, the score is constructed such that values are within [0, 1], with 1 being the highest possible score.
A chart illustrating the results of this new metric can be found below. This chart decomposes the metric so you can see how much PPG is contributing to the score versus minutes.

The full results can be found below:
Thoughts from a balcony
I hope this helps people take a more objective approach to player injuries while filling out their brackets. These results highlight that simply counting how many players are injured for a team is insufficient – consider that Seton Hall has 4 injured players compared to Providence’s 1, but the 4 Seton Hall Players only account for 7.5% of the team’s minutes, whereas the 1 injured Providence player accounts for over 10% of the team’s minutes.
Furthermore, an eyeball inspection of the composite score results shows that although a lot of teams look to be heavily impacted by injuries, there is a group of squads that are much worse off than everyone else: Ohio State (7 seed), Baylor (1), Creighton (9), and Houston (5). Importantly, 3 of these teams are the higher seed in the first round, so they may be good upset picks.
As always, don’t forget to Subscribe if you want to hear about new posts!

Hey! this is a great article on thissubject appreciate it!