This article is outdated. Please refer to my updated article for the 2024 Tournament.
Another year, another March Madness. As we scramble to fill out our yearly brackets, it’s important to keep injuries in mind. After all, a 2-Seed that lost its starting forward in the conference tournament may be less intimidating than a fully healthy 3-Seed on a roll.
This post attempts to statistically analyze the injuries of every NCAA Tournament team. I gathered player statistics and injury data from ESPN and Rotowire, and examined three basic metrics to assess the “injury level” of each team. Click to skip to any section:
- Total Season Minutes (%) accounted for by injured players
- Total Season Points (%) accounted for by injured players
- Composite Injury Score that takes into account total season minutes & total season points from injured players
Furthermore, we might also want to take into account that some currently injured players may be ready to play by the first round. As a result, injured players can be separated into two groups: Game Time Decision (GTD) or Ruled Out.
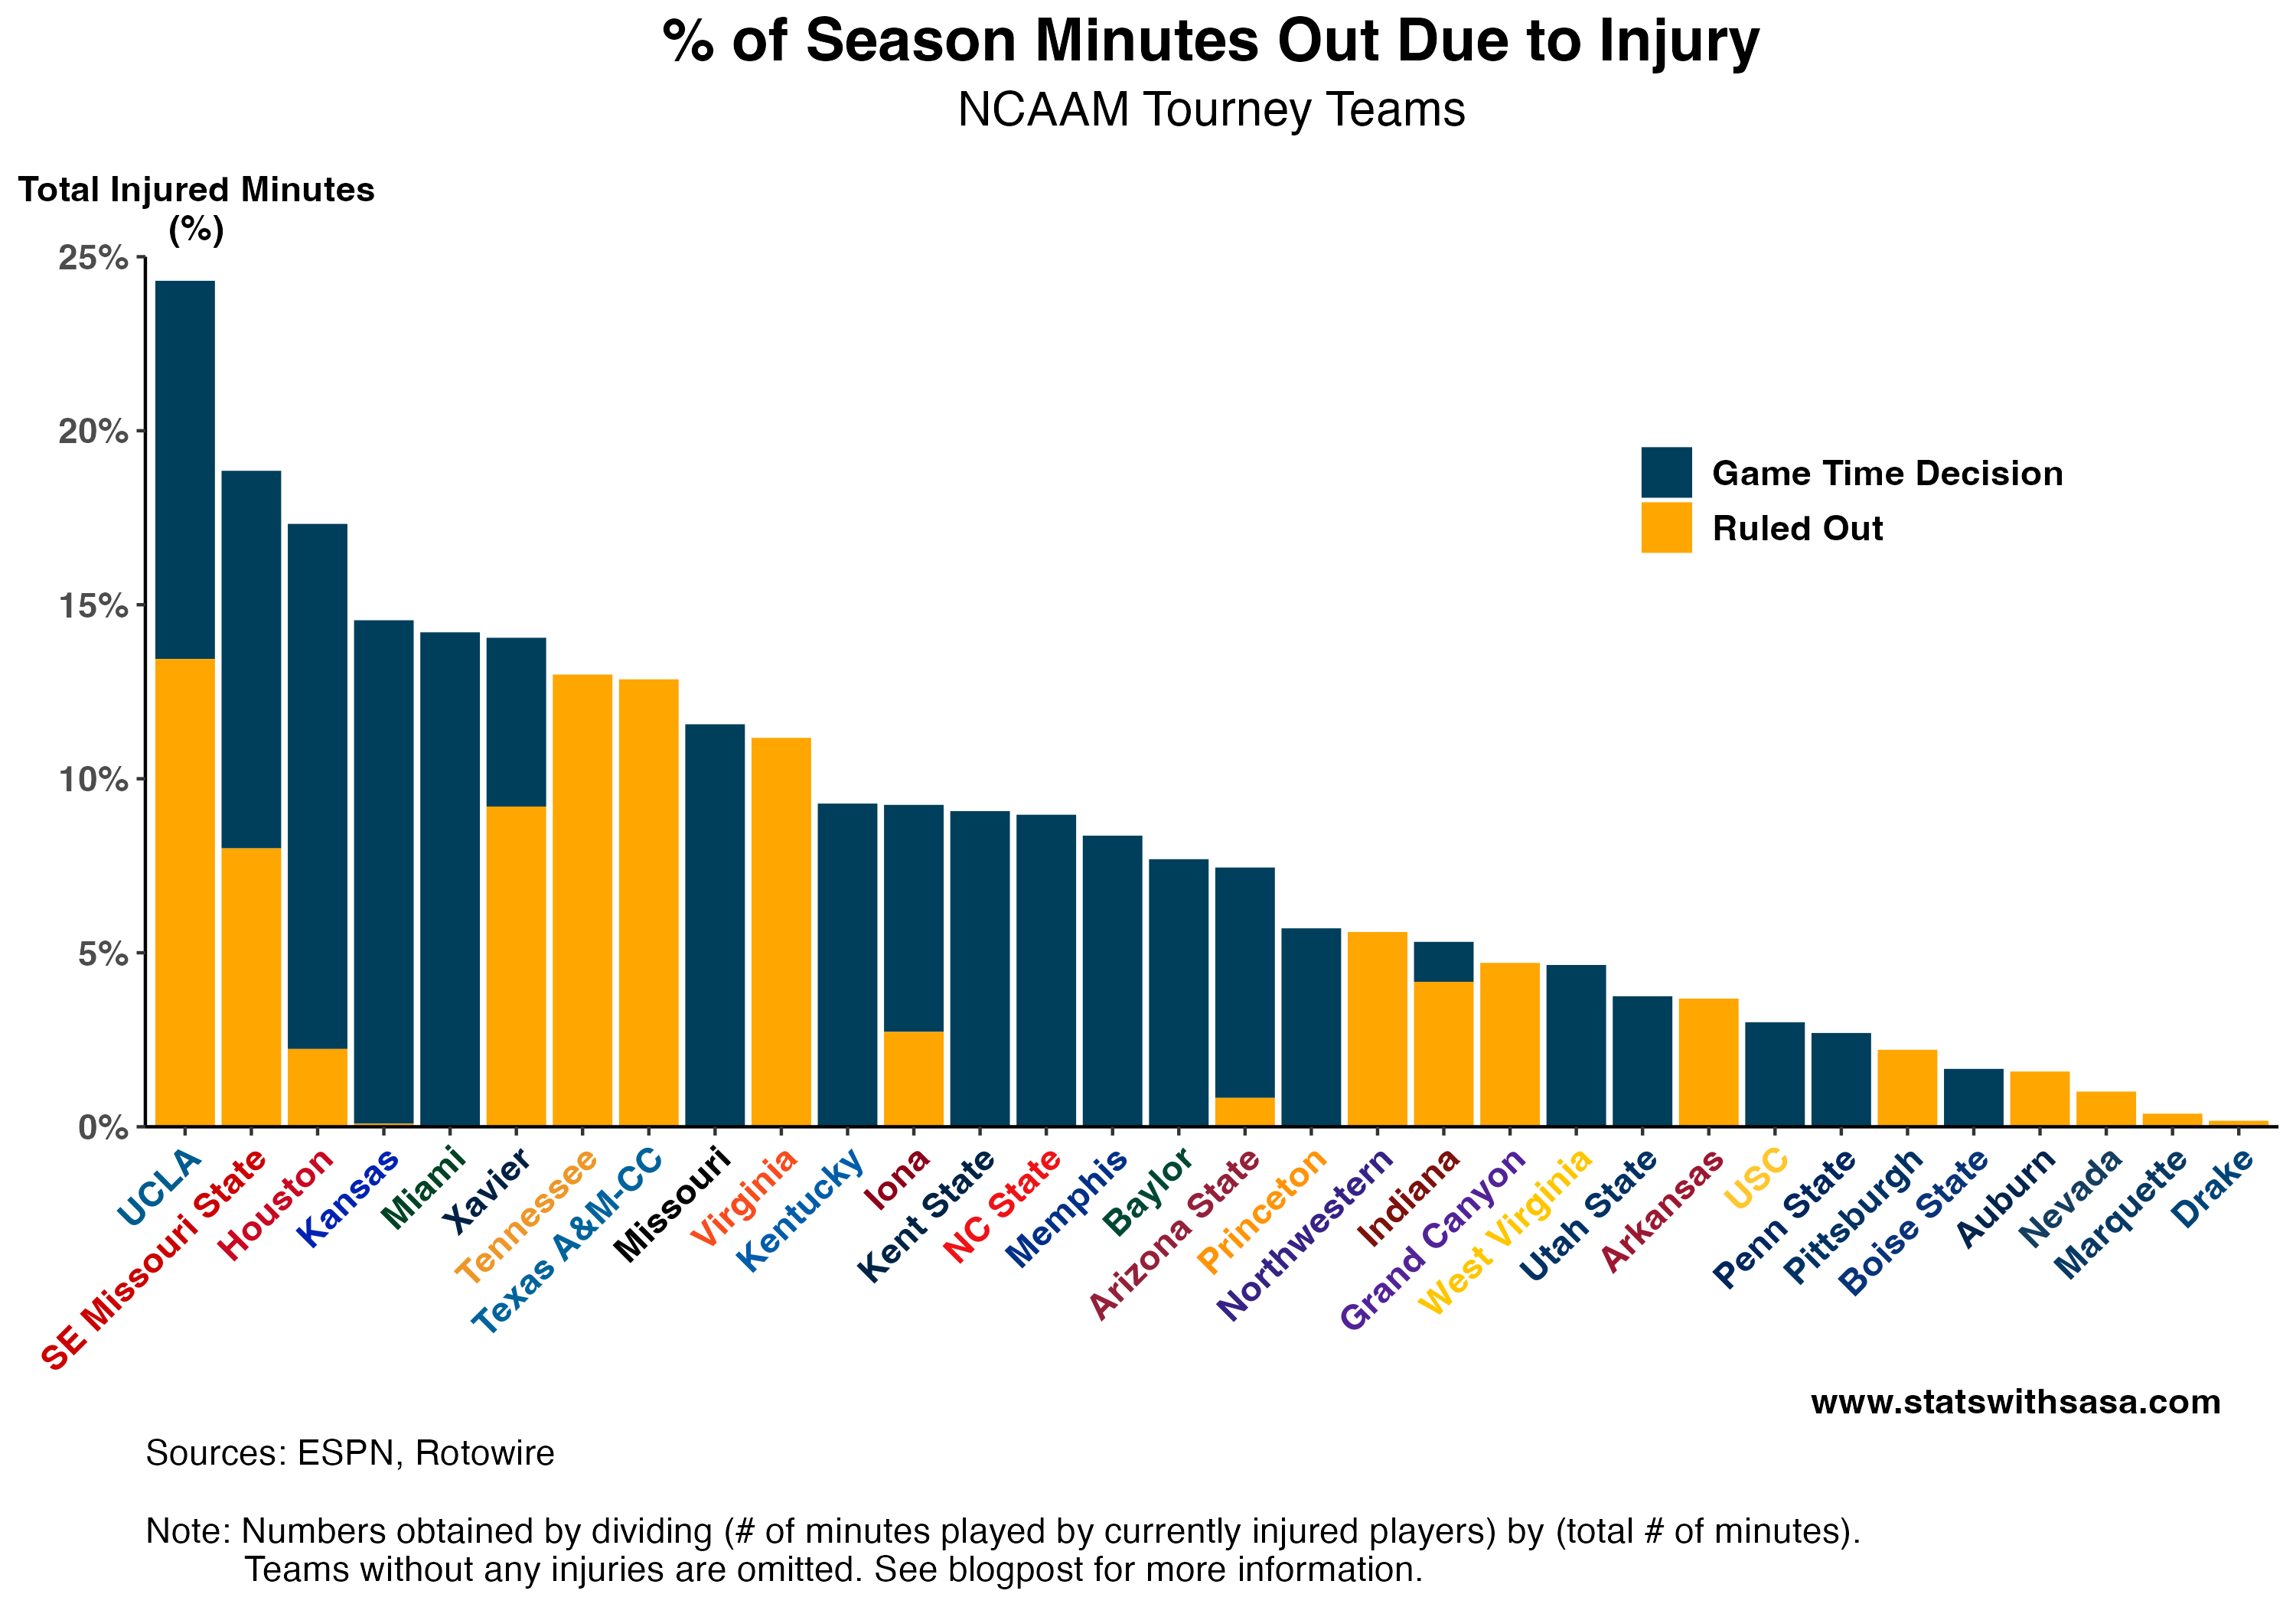
Total Season Minutes (%)
First, we can look at how many total season minutes were accounted for by currently injured players. To do so, we can simply sum the minutes played by currently injured players (i.e. before injury) and divide by the total number of minutes played by the team. A higher percentage indicates that players that normally play a lot of minutes have been injured. Teams with high percentages may struggle to adjust lineups in the tournament to compensate.
The following chart summarizes this:
The full results can be found below:
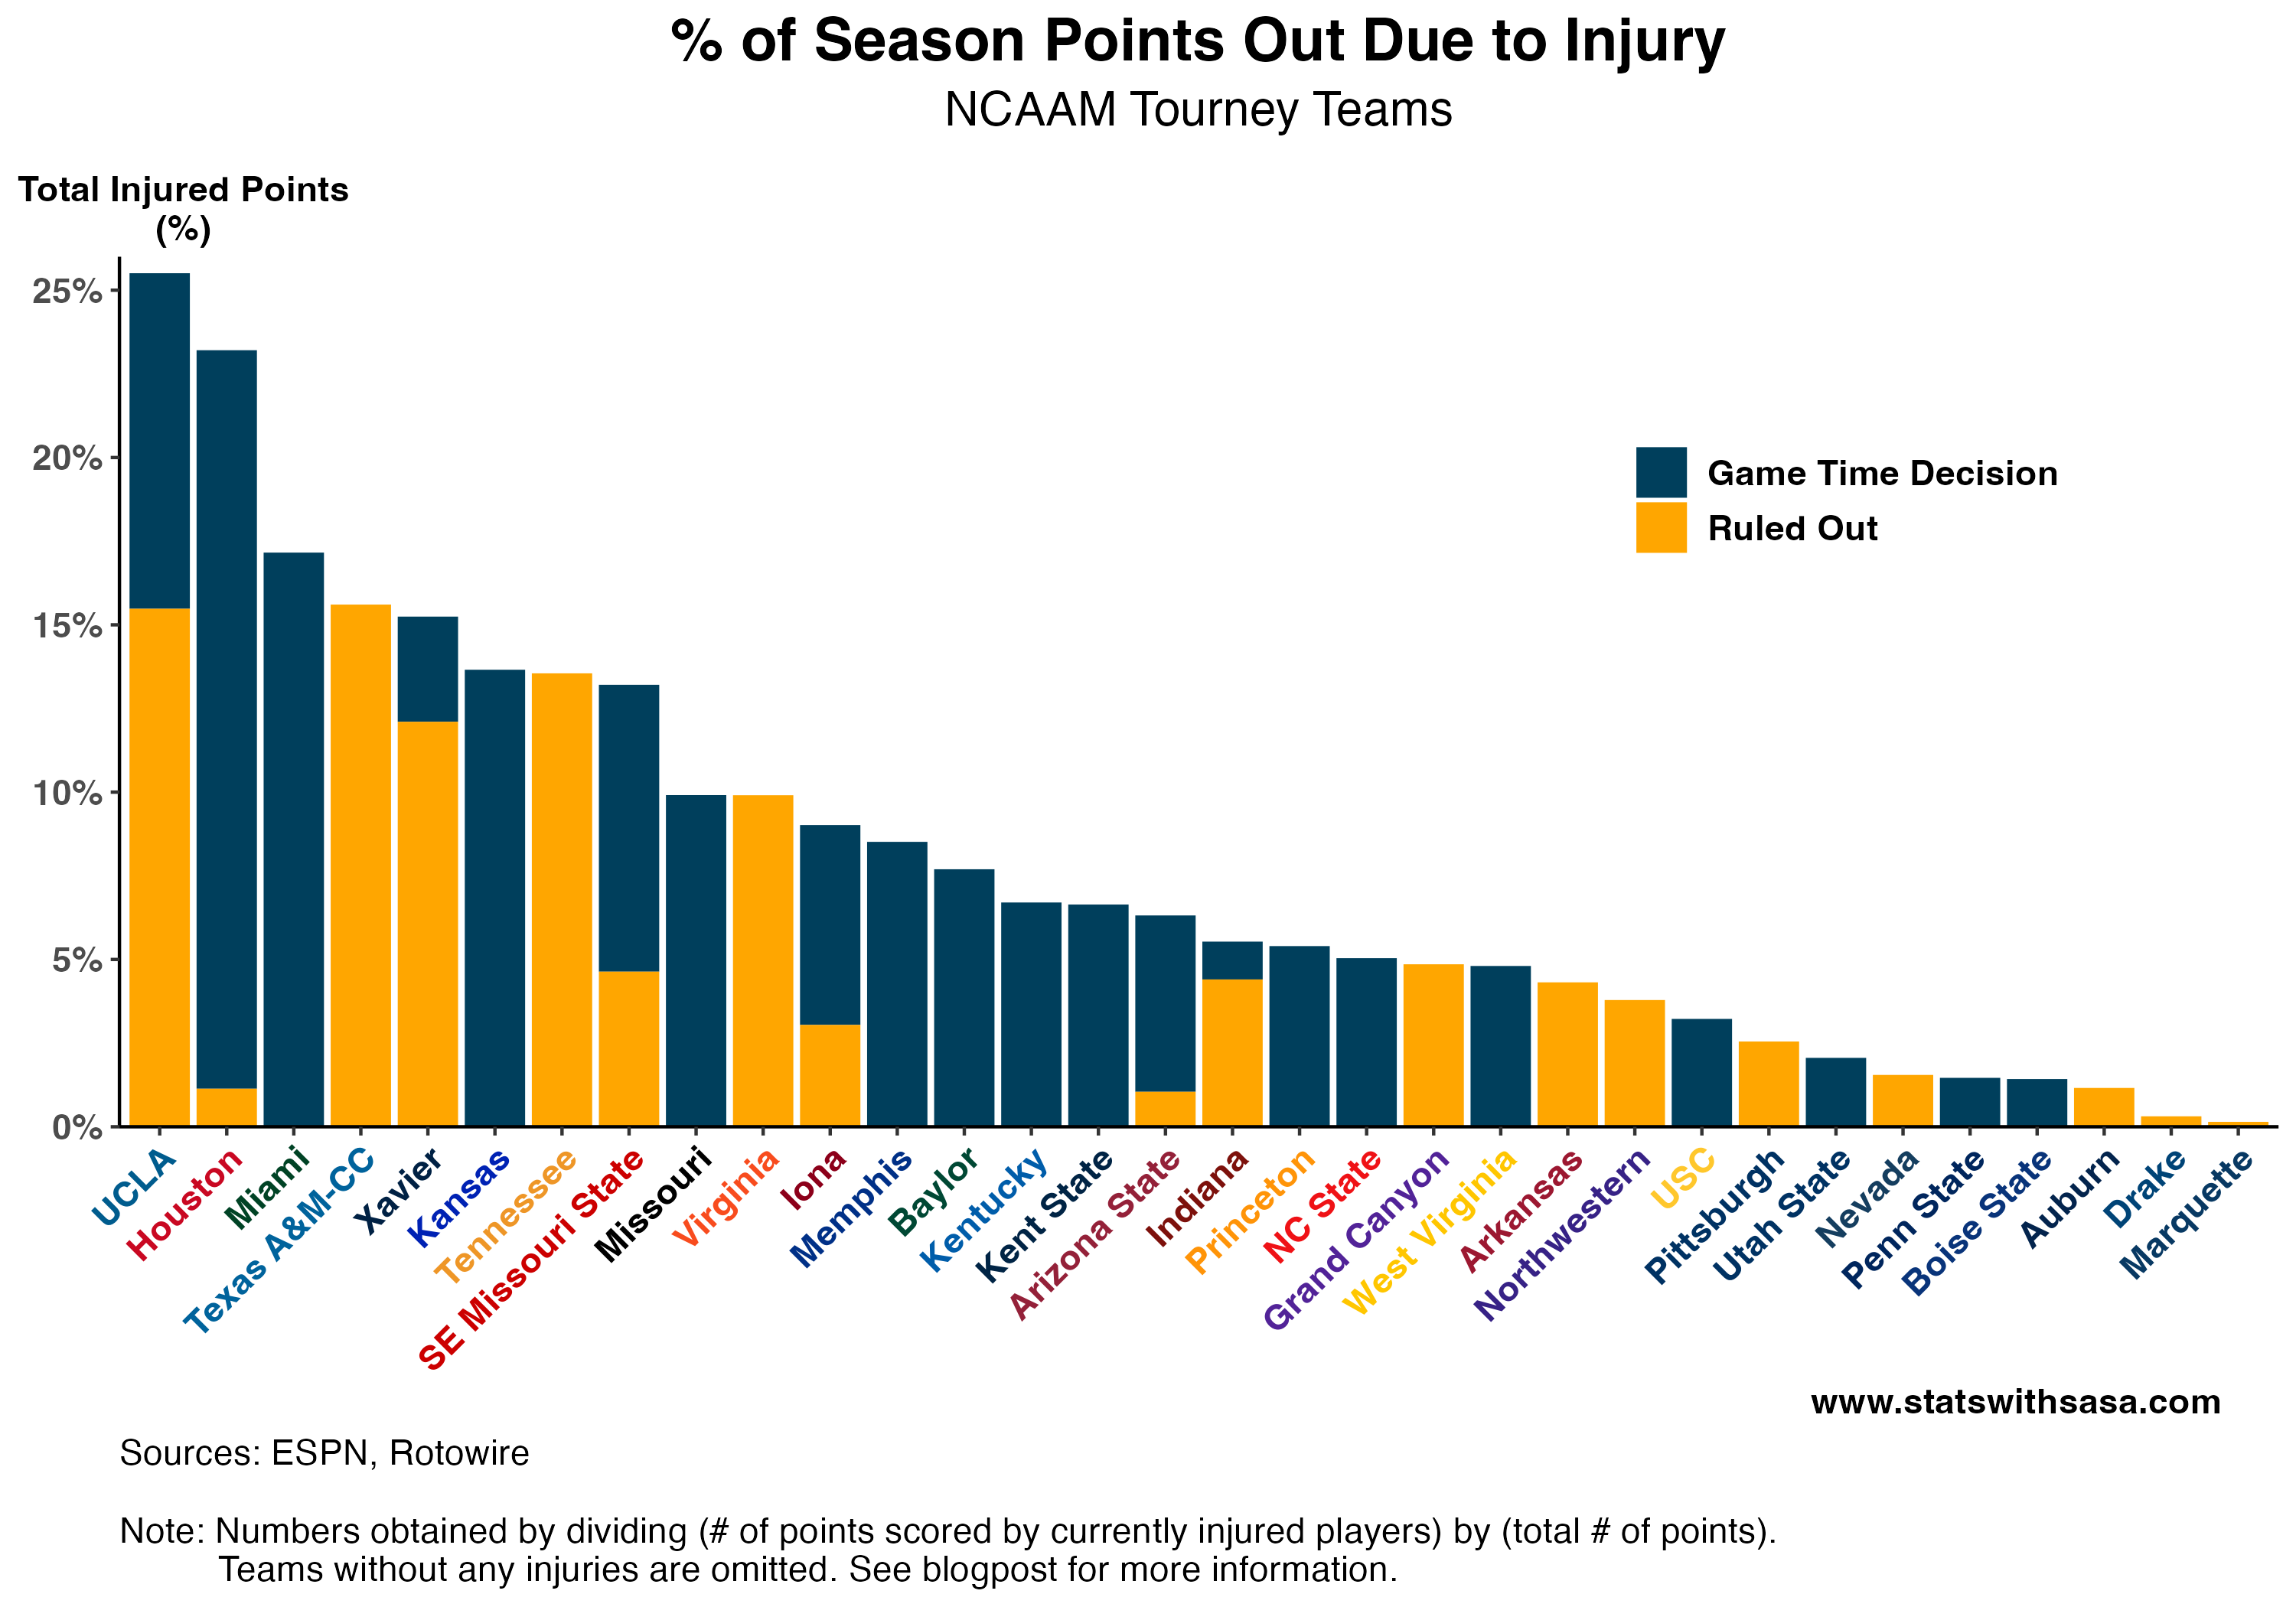
Total Season Points (%)
Although minutes are a useful yardstick to see how injured a team is, we may be more interested in the productivity of each injured player. In other words, how much did each player score this season? After all, basketball at the end of the day is about scoring the most points. To look at this, we can simply sum the total points scored by currently injured players and divide by the total points scored by the team.
A higher percentage indicates that players that normally score a lot of points have been injured. Teams with high percentages may struggle to find scoring replacements in the tournament. See below for the results:
And full results:
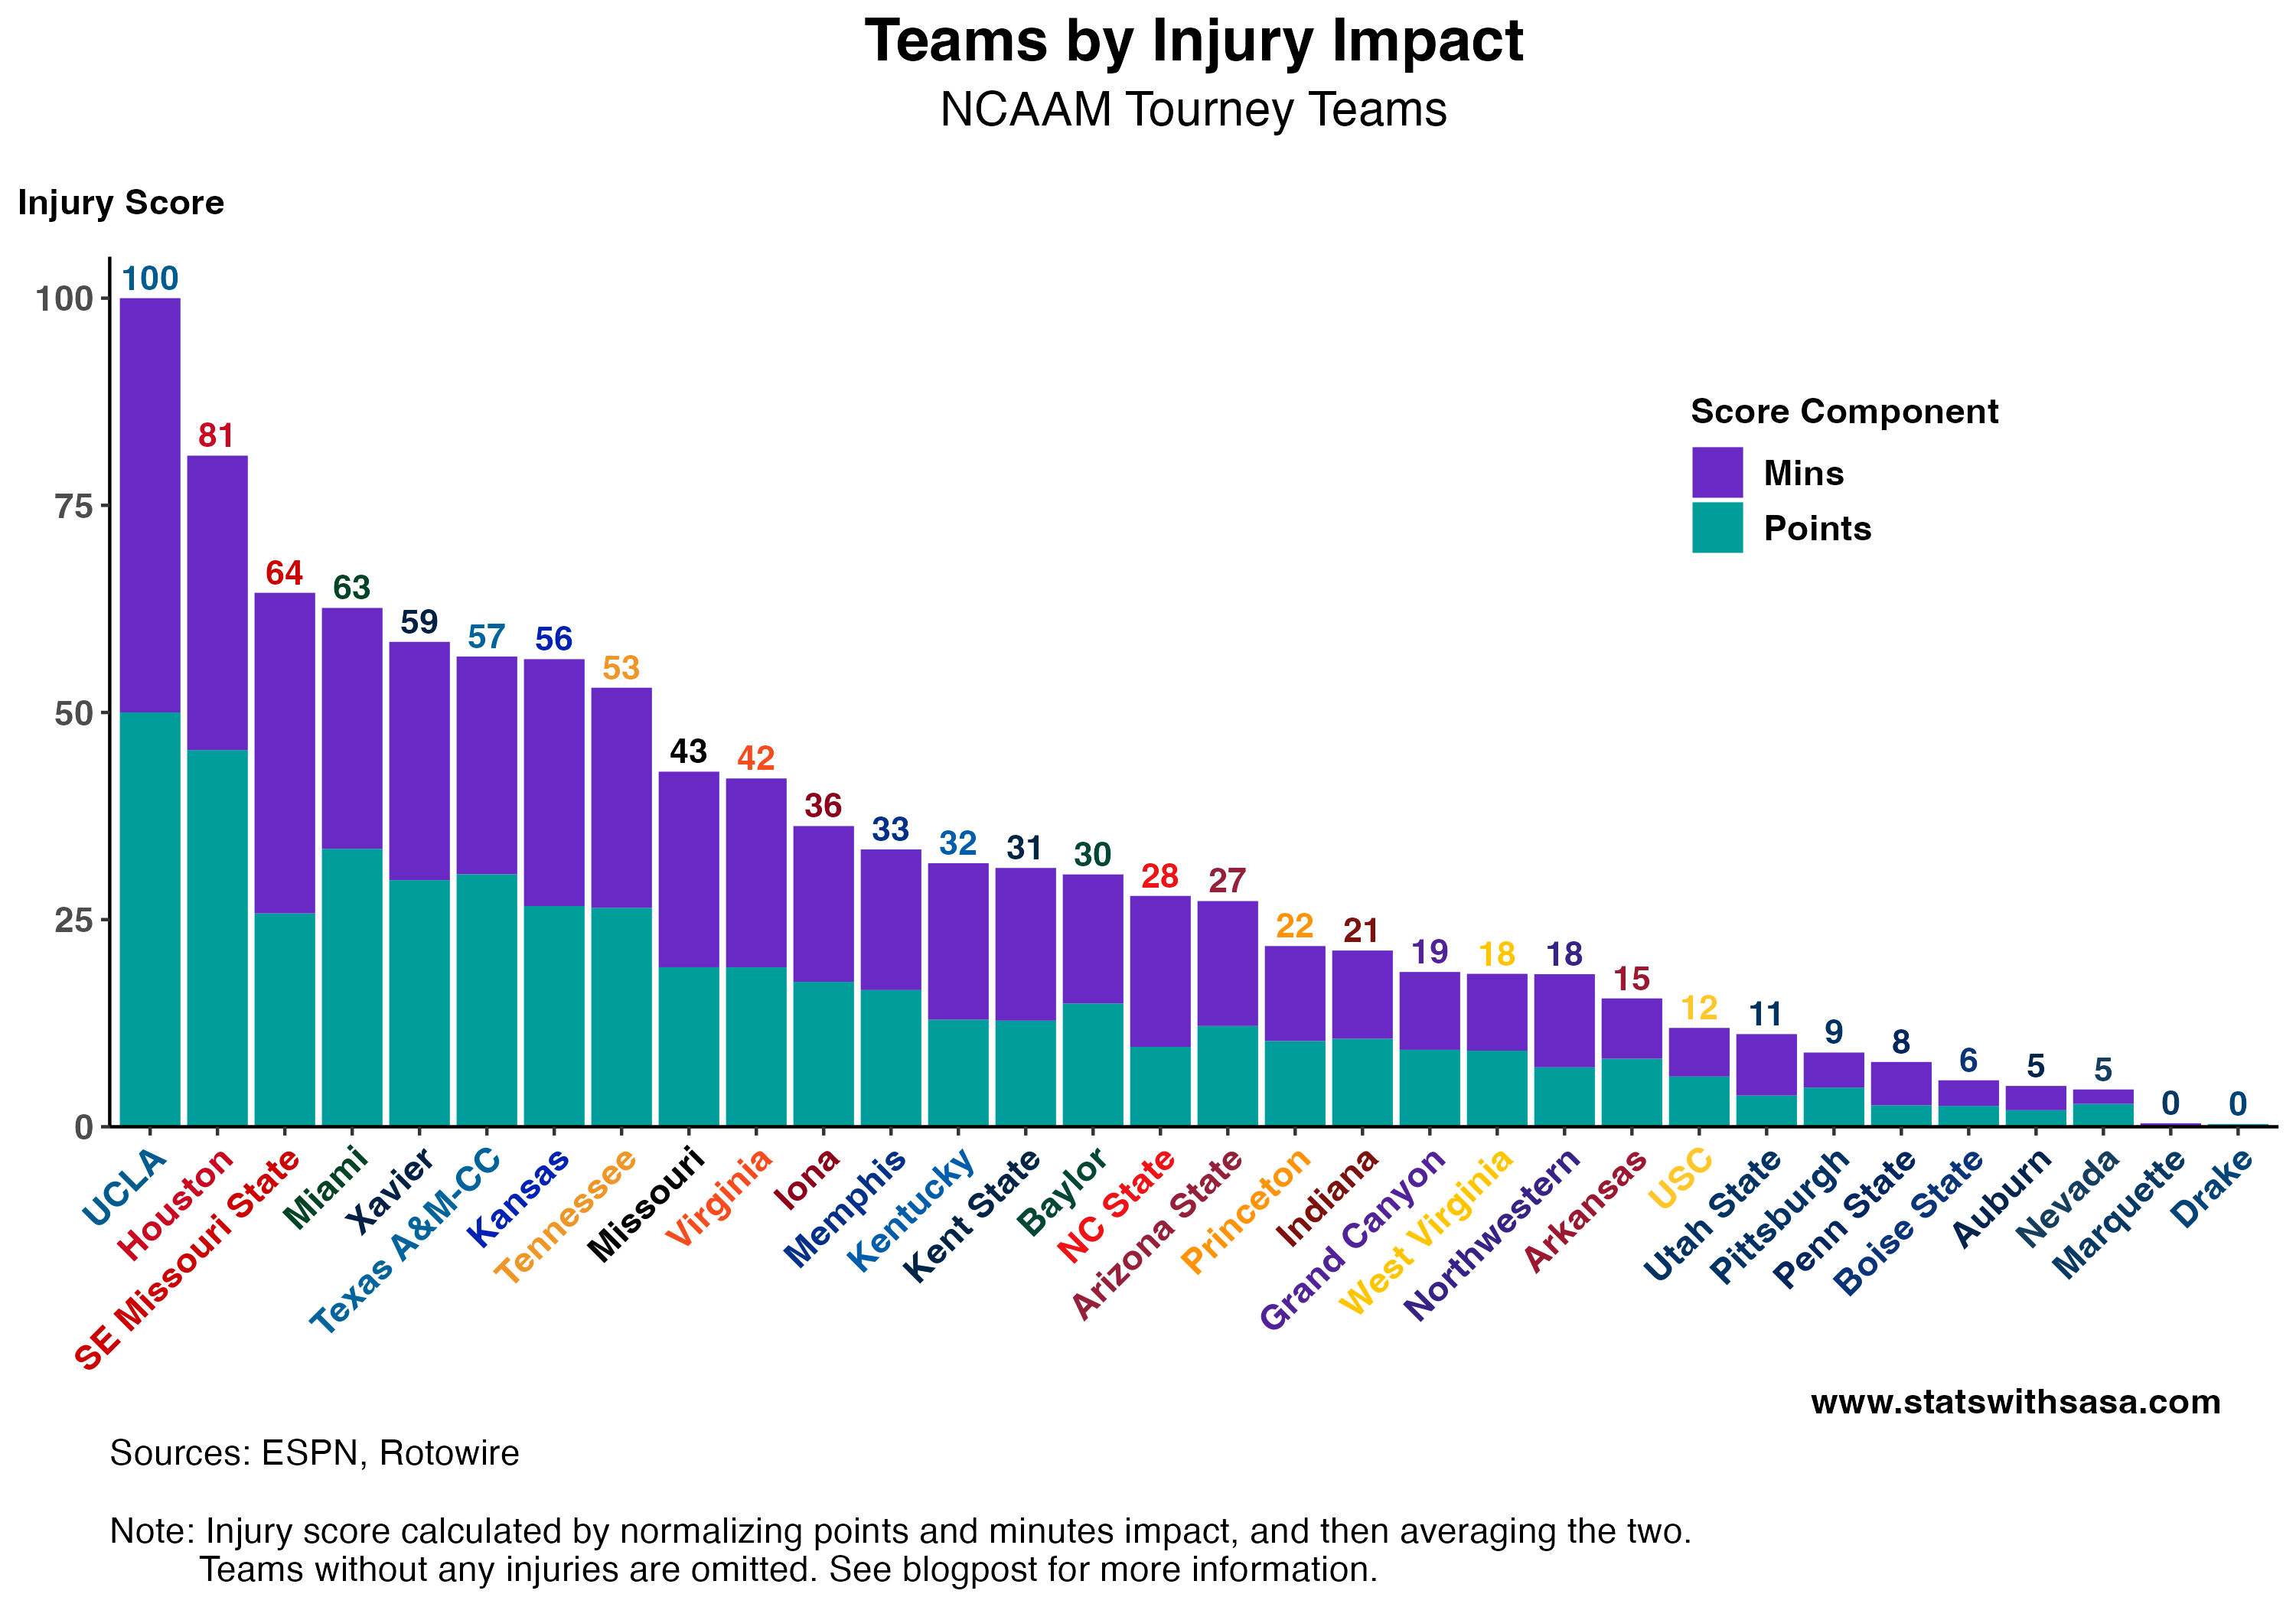
Composite Injury Score
We might also be interested in combining these two correlated, but different metrics to get a better idea of the full picture. To do so, I created a simple “composite score” by normalizing each variable and taking the average of the result. Since I took the mean of these normalized variables, the score is constructed such that values are within [0, 1], with 1 being the worst possible score.
A chart illustrating the results of this new metric can be found below. This chart decomposes the metric so you can see how much points are contributing to the score versus minutes.
Full results:
Potential Upsets
Upsets are one of the best parts of March Madness. Looking at recent injuries to key players may help us predict potential upsets. As a quick check for potential upsets, we can look at our Injury Scores. I classify a potential upset as a team that has a high Injury Score (>30) and a seed that is usually susceptible to upsets (seeds 5-8). The following table gives the teams that fit this criteria:
Note: This is a very simple check for upsets that is entirely based off relative injury status of each team. If you ask me, Memphis in particular is unlikely to get upset (despite injuries) given that they just upset the AP #1 team in their conference tournament.
Conclusion
I hope that this article helps people take a more objective approach to player injuries while filling out their brackets. Simply looking up and counting the number of injured players is insufficient to properly account for injuries. Consider that Indiana has 3 injured players compared to just 1 for Miami. However, those 3 Indiana players only combine for 5.5% of the team’s scoring this year. On the other hand, the injured Miami player accounts for over 17% of his team’s points this year.
A composite score gives us a more holistic approach to injuries and predicting their impact. This score indicates that UCLA, Houston, SE Missouri State, Miami, and Xavier seem to be the most impacted by injuries going into the tournament.
As always, don’t forget to Subscribe if you want to hear about new posts!